The stability of a protein formulation to a variety of solution perturbations is critical to its success as a pharmaceutical product. Because of the sensitivity of the protein to solution changes, invasive characterization techniques can be problematic. Light scattering is a non-invasive technique that has received wide acceptance in the area of protein and formulation characterization.
Light Scattering as a Characterization Tool
The scattering intensity of a small molecule is proportional to the square of the molecular weight. As such, dynamic and static light scattering techniques are very sensitive to the onset of protein aggregation arising from subtle changes in the solution conditions. Today's generation of light scattering instrumentation includes highly stable lasers, fiber optics, high speed correlators, and single photon counting detectors that facilitate the measurement of protein samples across a range of size and concentration that has never before been achievable.
Thermal Denaturation
The structure of a protein is stabilized by a large number of hydrogen bonds, hydrophobic interactions, and Van der Waal forces, each of which contributes a small degree of stability to the overall structure. As energy is added to the system via an increase in temperature, the stabilizing forces can be disrupted, allowing the protein to unfold or denature. The temperature at which this denaturation occurs is defined as the protein melting point.
When a protein denatures, the hydrophobic residues buried within the interior of the folded structure are exposed to the solvent. This entropically unfavourable state is soon replaced however, with one wherein the hydrophobic residues on one protein chain associate with those on another protein chain. Because of the molecular weight dependence of the scattering intensity, this non-specific aggregation of denatured proteins is easily monitored with light scattering instrumentation. Figure 1 shows a temperature scan for bovine haemoglobin, and clearly indicates a sharp increase in both the size and scattering intensity at the melting point of 45.5°C.
Figure 1. Thermal scan for bovine haemoglobin in 0.13 M phosphate buffered saline, indicating a melting point of 45.5 C.
The Quaternary Structure of Proteins
The quaternary structure or ordered self-association state of a protein can be influenced by solution properties such as the pH and the ionic strength. The precision of dynamic light scattering measurements is sufficient to distinguish changes in protein quaternary structure. For example Figure 2 shows the measured size distributions for human and bovine insulin at pH 2 and pH 7. At pH 2, the measured diameters for both proteins (see Table 1) are consistent with dimeric quaternary structures, where the molecular weight is estimated from empirically determined size vs. mass relationships. At pH 7, the measured diameters are consistent with the known hexameric forms of the proteins at physiological pH.
Figure 2. Size distributions for human and bovine insulin at pH 7 and pH 2, indicating a pH dependent change in quaternary structure.
Table 1. Comparison of the pH dependent calculated and known molecular weight values for human and bovine insulin.
|
|
|
|
|
|
|
|
Human
|
2
|
3.30
|
10.9
|
11.4
|
Dimer
|
|
|
7
|
5.37
|
33.9
|
34.2
|
Hexamer
|
|
Bovine
|
2
|
3.47
|
12.2
|
-
|
Dimer
|
|
|
7
|
5.33
|
33.4
|
-
|
Hexamer
|
Aggregation
Formulation additives, such as soaps and salts, can have a pronounced influence on the surface charge density of the protein and the solution ionic strength. Subtle variations in either of these parameters can mean the difference between a stable formulation and sample aggregation. Because of its sensitivity to high molecular weight particles, dynamic light scattering is a useful tool for monitoring the effects of formulation additives on protein aggregation.
Size Distribution as a Function of Ionic Strength
Figure 3 shows an overlay of the size distribution for bovine serum albumin as a function of ionic strength at the isoionic point of pH 4.8. For NaCl concentrations <0.5 M, the size distribution is monomodal, with a hydrodynamic diameter of about 8.5 nm. For NaCl concentrations <0.5 M, the size distribution is multi-modal, indicating the presence of protein aggregation.
Figure 3. Size distributions for human and bovine insulin at pH 7 and pH 2, indicating a pH dependent change in quaternary structure.
MW and Virial Coefficient
For small molecules such as proteins, the sample scattering intensity can be described using the Rayleigh expression shown in Equation 1, where K is an optical constant, C is the protein concentration, R is the Rayleigh ratio of the analyte intensity to the incident intensity, M is the weight average analyte molecular weight, and A is the 2nd virial coefficient.
As suggested in Equation 1, a plot of KC/R vs. C should be linear, with an intercept equivalent to 1/M and slope that is proportional to the 2 virial coefficient. This type of single angle molecular weight analysis is known as a Debye plot. An example is given in Figure 4, which shows the Debye plots for lysozyme in 0.1 M acetic acid buffer and 0.13 M phosphate buffered saline. The intercepts in both plots are consistent with the known molecular weight of 14.7 kDa. As seen in Figure 4 however, the 2 virial coefficients are strongly dependent upon the type of buffer used.
Figure 4. Debye plots for lysozyme in 0.10 M acetic acid buffer and 0.13 M phosphate buffered saline.
Shape Estimates
In dynamic light scattering measurements, the hydrodynamic size is calculated from the measured diffusion coefficient via the Stokes- Einstein equation, where a hard sphere model is assumed. Deviations in sphericity are reflected in an increase in the hydrodynamic size compared to the size calculated for a hard sphere of known molecular weight. From Perrin theory, the difference in these two values, i.e. hydrodynamic size and the hard sphere size, can be used to estimate the axial ratio for an ellipsoid with the same diffusional properties.
Figure 5 shows a representation of the crystal structure for lysozyme, and includes the geometric axial dimensions. The red circle is representative of the size of a hypothetical hard sphere for the 14.7 kDa protein (specific volume = 0.73 mL/g). The green circle is representative of the hydrodynamic size, calculated from the measured diffusion coefficient. The difference in the measured and theoretical values is consistent with an ellipsoid particle shape with an axial ratio of 1.73, identical to the axial ratio determined geometrically.
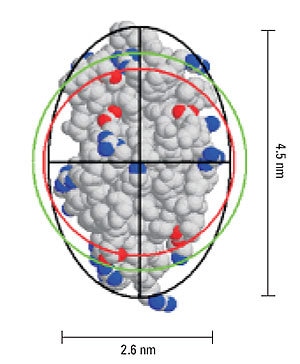
Figure 5. Representation of lysozyme, showing the geometric axial dimensions, the hard sphere diameter (red), hydrodynamic diameter (green), and an ellipsoid with the same diffusional properties as the protein (black).
HPPS
The High Performance Particle Sizer (HPPS) from Malvern Panalytical was specifically designed to meet the low concentration requirements typically associated with protein applications, along with the high concentration requirements for colloidal applications. Satisfying this unique mix of requirements was accomplished via the integration of a backscatter optical design, and as a consequence of this design, the specifications far exceed those for any other dynamic light scattering instrument. The HPPS hardware is self optimizing, and the software includes a unique "one click" measure, analyze, and report feature designed to minimize the learning curve.
Technical Specifications
|
|
|
|
Size range (diameter)
|
0.6nm to 6µm
|
|
Concentration range
|
0.1 mg/mL Lysozyme to 20% w/v
|
|
Sample Volume
|
12µL to 2mL
|
|
Laser
|
He-Ne, 3.0mW 633nm
|
|
Detector
|
Avalanche photodiode
|
|
Temperature control
|
10°C to 55°C (at 20°C ambient temp)
|
|
Extended temp unit
|
10°C to 90°C (at 20°C ambient temp)
|

This information has been sourced, reviewed and adapted from materials provided by Malvern Panalytical.
For more information please visit Malvern Panalytical.