The interactions governing protein-polyelectrolyte complexation have been the subject of many studies in the application areas of protein purification, enzyme immobilization, immunosensing, and bioactive sensors. These studies have also aided in the understanding of biological systems, for example, DNA-binding proteins, a field in which the general physical chemistry of the interactions has been subordinated to studies of storage, replication, and transcription mechanisms. This application note highlights the use of the Malvern Panalytical Zetasizer Nano ZS for characterization of protein-polyelectrolyte complexes (PPCs).
Experimental
The PPC system examined in this study was composed of bovine serum albumin (BSA), with an isoelectric point (pI) of 4.8, and a custom synthesized anionic copolymer of 60% 2-acrylamido-2-methylpropanesulfonate and 40% acrylamide (AMPS60Aam40). Protein-polyelectrolyte solutions were prepared at a 5:1 mass ratio of protein to polyelectrolyte in 250 mM NaCl at pH 8.5. Dynamic light scattering measurements of the filtered solutions (0.22 mm Sartorius) were collected with the Zetasizer Nano ZS system at 0.2 pH unit intervals from pH 8.5 to pH 4.2. The deconvolution of the measured correlation curve to an intensity size distribution was accomplished using a non-negative least squares algorithm.
Results
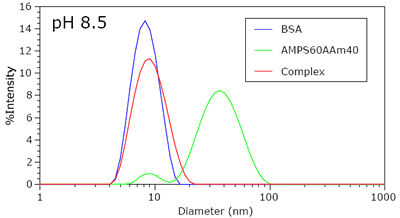
Figure 1 shows the intensity size distributions for BSA, AMPS60AAm40, and the complex at pH 8.5. At this pH, the negative charge on the protein is sufficient to prohibit complexation with the polyanion. Because of the higher mass concentration and globular nature of the protein, the unbound polyanion cannot be detected in the presence of protein.

Figure 1. Intensity size distributions for BSA, AMPS60Aam40, PAMPS80, and a BSA-AMPS60AAm40 mixture in 250 mM NaCl at pH 8.5.
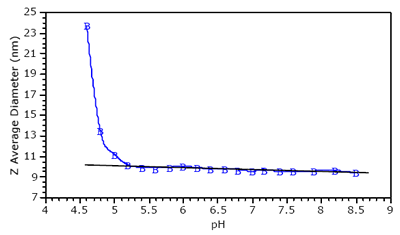
The pH dependence of the Z-average diameter for the protein-polyelectrolyte complex is shown in Figure 2, which indicates a deviation from baseline at circa pH 5.0. The Z-average size is the intensity weighted mean diameter, derived from a Cumulants or single exponential fit of the intensity autocorrelation function. The deviation from linearity shown in figure 2 is typical of protein-polyelectrolyte mixtures, and allows one to define the pH of initial complex formation (pHc). At pH 5, the net BSA charge is negative. As such, the binding of BSA to a polyanion at pH 5.0 suggests that the protein-polyelectrolye interactions are local, between the negatively charged polymer and a positive charge patch on the surface of the protein.

Figure 2. pH dependence of the Z-average diameter of BSA-AMPS60AAm40 in 250 mM NaCl.
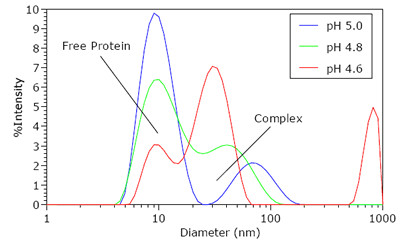
Figure 3 shows the intensity size distributions for the protein-polyelectrolyte complex for pH ¡Ü pHc. As seen in Figure 3, a bimodal distribution is clearly visible at the onset of complexation. The faster diffusing mode, with an apparent diameter of 8 nm, corresponds to free BSA. The slower diffusing mode at circa 75 nm represents the protein-polymer complex, with an apparent size that is roughly the same as that of the free polyelectrolyte. As the pH is decreased, the apparent size of the complex peak shifts to lower values, accompanied by a decrease in the relative scattering intensity of free BSA. This reduction in the relative scattering intensity of the free protein suggests that pH reduction leads to an increase in protein binding and complex formation.

Figure 3. Intensity size distributions for the BSA-AMPS60AAm40 complex for pH ¡Ü pHc.

This information has been sourced, reviewed and adapted from materials provided by Malvern Panalytical.
For more information please visit Malvern Panalytical.