Sponsored by HORIBAAug 17 2005
The optical properties of quantum dots (QDs) have potential applications in optoelectronics, biosensing and biolabeling, memory devices, and sources of laser light. For example, alloyed CdSeTe QDs are shown herein to possess a nonlinear change in their photoluminescence spectra, correlated to size and composition, as monitored by the versatile HORIBA FluoroMax® spectrofluorometer. The QDs' emission wavelength can be as high as 850 nm, which may be useful for imaging deeper into living tissue than visible light can penetrate.
Synthesizing Alloyed CdSeTe Quantum Dots - a Description of the Experimental Process
The procedure for synthesizing alloyed CdSeTe QDs (2.7-8.6 nm diameter) from pure CdO, Se shot, and Te powder in tri-n-octylphosphine oxide and hexadecylamine is in the ‘Journal of Physical Chemistry’ (100, 8927-8939, 1996). The nanoparticles were purified by precipitation and centrifugation, then stored at room temperature. Absorption spectra were monitored on a Shimadzu spectrophotometer (slit = 1.0 nm). Fendler et al's method for finding the absorption onset and band-gap energies was used with the absorption data. Photoluminescence spectra were recorded using a HORIBA FluoroMax® spectrofluorometer. The emission spectra were performed with an excitation wavelength of 475 nm and slit-widths of 2.0 nm. All spectra were corrected for the detector's wavelength-dependent response.
The Results that Emerged from this Experiment
QDs in layered solutions (CCL4 below; water, above) under ambient and UV light are shown in Figure 1. QDs coated with tri-n-octyl phosphine oxide remain in the organic layer, while those coated with mercaptoacetic acid are in the aqueous layer.
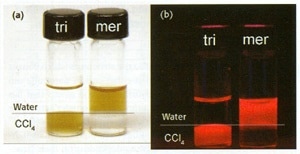
Figure 1. QDs coated with tri-n-octyl phosphine oxide (tri) and mercaptoacetic acid (mer) under (a) ambient and (b) ultraviolet illumination. The upper layer is water; the lower layer is CCL4.
Studying Alloyed Quantum Dots Using Absorption and Photoluminescence Spectroscopy
A range of alloyed QDs were examined via absorption and photoluminescence spectroscopy (see figure 2, below). Comparative literature values for bulk alloys are included. The data reveal resolved electronic transitions, plus fluorescence emission at the band-edge. Note the unexpected depression in band-gap for all nanoparticle sizes at about 60% Te. The generally successful Vegard's law for thin-film and bulk alloys is linear:
Ealloy = xEA + (1 - x)EB
where x = mole fraction, and EA, EB and Ealloy are the band-gaps for pure materials A, B and alloy of A and B respectively. Vegard's law, however, is only a first approximation, and others have found this "optical bowing" in bulk CdSeTe, so this effect is not solely caused by quantum confinement.
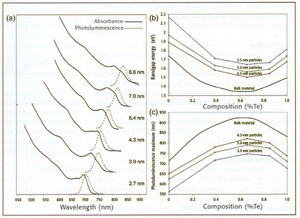
Figure 2. Composition versus absorption and emission energies for CdSe1-xTex nanoparticles. (a) Absorption and photoluminescence of CDSe0.34Te0.66 QDs; (b) absorption-energy onset related to Te content; (c) emission peak-wavelength versus Te content.
Explaining the Behaviour of Quantum Dots When Examined with Absorption and Photoluminescence Spectroscopy
Zunger et al suggest the observed effects arise because of: (a) the various ionic sizes in the alloy; (b) the various electronegativities of these ions; and (c) the binary structures of these ions have various lattice constants. Relaxation of the ionic bonds to equilibrium positions may lead to local order in the structure and a larger than expected reduction in the band-gap.
Conclusions
Particle size and composition can control quantum confinement. These QDs may be useful for molecular imaging in living systems, because of their near-IR and far-red fluorescence, where deep-tissue imaging is necessary, away from blood and water light-absorption QDs also provide absorption coefficients an order-of-magnitude larger than typical organic dyes. The ultra-sensitive HORIBA FluoroMax® spectrofluorometer is useful in a wide array of research related to nanostructures and materials science for the future.

This information has been sourced, reviewed and adapted from materials provided by HORIBA.
For more information on this source, please visit HORIBA.