Despite initial skepticism, acceptance of the existence and special properties of nanobubbles is now growing and their formation and characteristics are now becoming the subject of an increasing amount of study, especially in Japan.
Due to the supposed very high pressure within bubbles of such small size and radius of curvature, and thus high surface tension, conventional calculations show that the gas should be ‘pressed out’ of the nanobubbles within microseconds.
However, it is now clear that under the right conditions such bubbles can both form freely and remain stable for extended periods of time, sometimes for many months. Explanations as to just why such structures are so stable are focusing on the role of counter-ions forming layers at the nanobubbles surface, explaining claims that they apparently form only in the presence of salts.
Kaneo Chiba and Masayoshi Takahashi of Japan’s famous AIST research centre have shown that in the presence of electrolytes and with the correct physical stimulus, stable nanobubbles can be formed from conventional microbubbles. The latter tend to coalesce to large buoyant bubbles which either float away or collapse under intense surface tension-derived pressure to the point that they vanish, as predicted by theory.
However, the addition of salt (electrolytes) is thought to cause the formation of a counter-ion screen around the nanobubbles which effectively blocks the ability of gases within them to diffuse out.
Furthermore, Prof. William Drucker of the University of Melbourne has also used infra-red spectroscopy to show that the pressure of gas within such nanobubbles is not significantly higher than atmospheric pressure, perhaps explaining their stability and resistance to collapse.
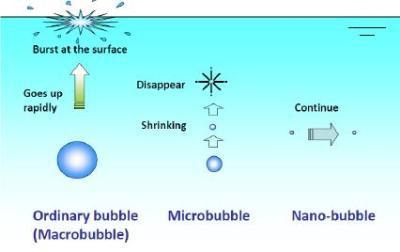
Figure 1. The formation of nanobubbles.
Measuring Nanobubbles
In an earlier study, Kikuchi et al (2001) showed that the formation of hydrogen nanobubbles was related to the influence of electrolysis conditions on the hydrogen content and the diameter distribution of hydrogen nanobubbles. In this study, Dynamic Light Scattering (DLS) was used to analyze the nanobubbles.
However, in a recent study of the formation and characterization of nanobubbles in water by a major pharmaceutical company in Japan, the concentration of nanobubbles in a mechanically formed suspension was found to be very low (<107/ml), a concentration which would be too low for meaningful analysis of DLS. Of course, analysis by Electron Microscopy was not possible because of the vacuum required for EM studies.
NanoSight was shown to be ideally suited to such analyses. In a blind experiment in which three samples of nanobubble suspensions containing high, low and zero numbers of nanobubbles were tested in duplicate, NanoSight results were found to match exactly those predicted.
Figure 2 below shows the results in which sample A (series 1 and 6) contained a high concentration of nanobubbles, sample B (series 3 and 5) contained a low concentration of nanobubbles and sample C (Series 2 and 4) were control blanks. It should be noted that NanoSight measures concentration of nanobubbles per unit volume as well as size and size distribution.
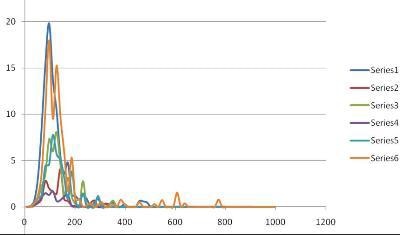
Figure 2. NanoSight results.
More recently, Ichiro Otsuka (2008) of Ohu University, Japan has studied the possible role of nanobubbles in ultra-high diluted samples of active agents in which the phenomenon of succussion is considered relevant.
He used NanoSight technology to examine nanobubble formation and concentration in more detail than was possible using an electrozone (Coulter) method or conventional DLS techniques.
Applications
There exists a wide range of proposed nanobubble applications and interest in their usage is growing rapidly. When formed from ozone and electrolyte stabilised, disinfection and sterilisation is possible for many months with great potential in the preservation of foodstuffs and in medical applications as an attractive alternative to chlorine based methodologies.
Oxygen nanobubbles have been implicated in the prevention of arteriosclerosis by the inhibition of mRNA expression induced by cytokine stimulation in rat aorta cell lines.
When formed in liquids in capillaries, nanobubbles have been shown to greatly improve liquid flow characteristics. They have also been proposed as contrast agents in scanning techniques as well as cleaning agents in silicon manufacturing processes.
Finally, a new field of drug delivery applications is being actively researched in which nanobubbles play an active part though details of this highly secretive field are hard to come by. However, reported in Reuters, Natalya Rapoport of the University of Utah's Department of Bioengineering is using nanobubbles with the chemotherapy drug doxorubicin to seek out and congregate at cancer tumors when injected into the bloodstream.
"These nanobubbles don't penetrate normal blood vessels but they do penetrate blood vessels in the tumor," said Rapoport, whose study appears in the Journal of the National Cancer Institute. Once in the tumor, the nanobubbles combine to form larger microbubbles which can be seen on an ultrasound.
"When these bubbles accumulate, I give strong ultrasound radiation to the tumor to blow them up," she said in a telephone interview. "The drug then gets out of these bubbles locally at the tumor site."
In Conclusion
NanoSight has proved uniquely capable of visualising, sizing and counting nanobubbles in liquids. The concentration ranges encountered in this application frequently appear ideal for analysis by NTA.

This information has been sourced, reviewed and adapted from materials provided by Malvern Panalytical.
For more information please visit Malvern Panalytical.