Characterizing the state of aggregation in proteins is of paramount importance when trying to understand product stability and efficacy. Product quality, both in terms of biological activity and immunogenicity can, be highly influenced by the state of protein aggregation. Protein aggregation can occur at all steps in the manufacturing process (cell culture, purification and formulation) and hence, by determining the state of aggregation, modification/optimization of the process can be achieved.
A new laser-based nanoparticle tracking analysis system is now available which allows nanoscale particles, such as protein aggregates, to be directly and individually visualized and counted in liquid in real-time, from which high-resolution particle size distribution profiles can be obtained. The technique is fast, robust, accurate and low cost representing an attractive alternative or complement to existing methods of nanoparticle analysis such as Dynamic Light Scattering, DLS (also known as Photon Correlation Spectroscopy, PCS) or Electron Microscopy (EM).
Imaging Protein Aggregates
The NanoSight from Malvern Panalytical offers unique insight into protein aggregation in the range of 30 nm-1000 nm.
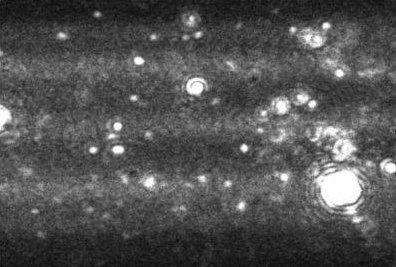
Figure 1. A typical image produced by the NanoSight technique. The image allows the users to instantly recognize certain features about their sample.
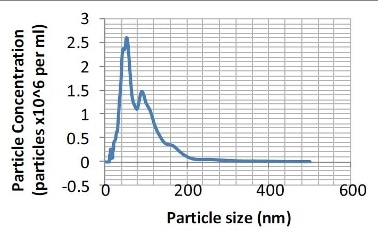
Figure 2. Particle size distribution (number distribution) produced from the sample shown in Figure 1.
Covering the Protein Aggregate Size Range
Historically a number of techniques have been used to characterize proteins and protein aggregation. Often separation techniques are used to discriminate proteins and protein aggregates, with further analysis performed on a separated sample.
Analytical Techniques:
- Dynamic Light Scattering (DLS)
- Multi-Angle Light Laser Scattering (MALLS)
- UV Spectroscopy
- Light Obscuration
- Micro-Flow Imaging (MFI)
- Nanoparticle Tracking Analysis (NTA)
Separation Techniques:
- Size Exclusion Chromatography (SEC)
- Field Flow Fractionation (FFF)
- Capillary Electrophoresis. (CE)
- Analytical Ultracentrifugation (AUC)
Sub 30 nm Aggregates
It is common to find SEC paired with DLS, MALLS or UV spectroscopy. Size Exclusion Chromatography can be used to separate protein monomers from aggregates. Subsequent analysis using DLS for example, can produce accurate size/molecular weight analysis for purified fractions. Above the exclusion limit of the SEC column there is no separation and hence bulk analysis systems such as DLS become less well suited. MALLS analysis can help reduce the effect of larger aggregates in non-fractionated samples but the technique requires interpretation.
30 - 1000 nm Range
The NanoSight technique allows protein aggregates within the size range of 30 - 1000 nm to be individually imaged and sized by tracking their Brownian motion on a particle-by-particle basis. Particle-by-particle analysis allows high resolution number distributions to be generated. This region is often poorly served by DLS with high concentration of protein monomer and low number of large, bright aggregates often dominating the signal.
Whilst fractionation can be performed such as with FFF to aide DLS analysis, the dilution that is often required for FFF can make this route undesirable due to the potential for further aggregation. Furthermore, dilution of these 'mid-sized' aggregates often takes them below the sensitivity limit for DLS. The Nanosight technique frequently requires no dilution as the 30-1000 nm protein aggregates often fall within the optimum concentration range for this technique.
The cut off limit of the NanoSight technique (30 nm for protein aggregates) means that it is well suited to complement SEC/DLS or SEC/UV above the exclusion limit of SEC. The upper limit of the NanoSight technique represents the point at which conventional single particle imaging/obscuration techniques become applicable.
With no prior separation of aggregates, DLS would typically produce a bimodal result for the aggregated sample shown in Figure 3. The primary peak would by formed from the large number of monomeric particles, while the secondary peak would be formed by very large aggregates which scatter significant intensities of light. A poorly resolved DLS analysis would show no particles between these points despite their existence as the primary monomeric particles and the few larger aggregates would dominate the signal.

Figure 3. Image produced by Nanosight LM10-HS instrument showing a heavily aggregated protein sample.
Whilst the NanoSight technique would be unable to measure the primary monomeric size as the particles would fall below the detection limit of the technique, above 30 nm, the technique provides particle-by-particle analysis of protein aggregates, uniquely forming a high-resolution number distribution of aggregated particles.
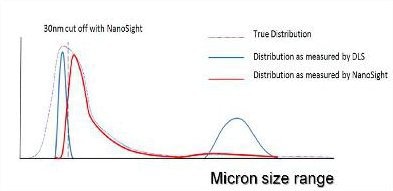
Figure 4. A representation of the distribution of particle sizes which may be contained within an aggregated protein sample.

This information has been sourced, reviewed and adapted from materials provided by Malvern Panalytical.
For more information please visit Malvern Panalytical.