In hard disk drives, digital information is stored and retrieved magnetically by a “read head” that flies over the disk within tens of nanometers of its surface. Figure 1 is a photograph of a read head and hard disk together.
To protect the magnetic material in which information is stored, a hard overcoat (which may be as thin as just a few nanometers) is applied to the surface. The hard overcoat protects the underlying material by acting both as a lubricant and a mechanical barrier.

Figure 1. Interior of a hard disk drive, copyright Matt Field.
Hard-disk manufacturers are keenly interested in measuring the mechanical properties of such overcoats in order to gain knowledge for product improvement; instrumented indentation has emerged as the technique of choice for making these measurements. Because the coating is so thin, however, indentation results for the overcoat are inevitably lower than the true values. That is, some of the deformation from the indentation test is accommodated by the material under the coating of interest, which makes the coating appear more compliant than it actually is.
Without any correction for influence of the underlying material, one faces a compromise between uncertainty and error. At very small displacements, the error due to the substrate influence may be small, but the uncertainty is greater due to surface roughness, tip variations, vibration, temperature variations, etc. As indentation depth increases, the uncertainty decreases, but the error due to substrate influence increases. Thus, the purpose of this work was to apply an analytic model to the analysis of hard coatings tested by instrumented indentation in order to obtain the Young’s modulus of the film alone.
Such a model was recently introduced and verified via finite-element analysis [1]. Developed by KLA, it is referred to as the “Hay-Crawford” model.
The Hay-Crawford Model
The Hay-Crawford model provides an analytic means of accounting for substrate influence on measured modulus [1]. Here, we shall simply summarize its details by presenting the inputs and output of the model.
Inputs to the model:
- The apparent (substrate-affected) Young’s modulus as measured by the Oliver-Pharr method [2]
- Film thickness
- Poisson’s ratio of the film
- Young’s modulus of the substrate
- Poisson’s ratio of the substrate
The output of the model is the substrate-independent Young’s modulus of the film. Note that although the Poisson’s ratios of the film and the substrate are both required inputs, the output of the model is rather insensitive to these parameters.
In this work, we tested and analyzed two samples provided by Seagate Technology, a major manufacturer of hard disk drives. The samples were produced for the purpose of evaluating the Hay-Crawford model for substrate influence. As such, the coatings tested in this work were substantially thicker than overcoats for an actual hard disk. Also, the coatings were deposited on silicon rather than magnetic media. These simplifications allowed for a rigorous evaluation of the model because (1) substrate influence was slight at shallow depths and (2) the substrate properties were well known.
Experimental Method
Two silicon-carbide (SiC) films on silicon were tested; the thickness of the first film was 150 nm and the thickness of the second film was 300 nm. The SiC films were deposited onto prime silicon substrates using an industrial PVD system equipped with a planar magnetron sputter source and a 99.99% pure silicon-carbide target. For these samples, a value of 170 GPa was used for the Young’s modulus of the substrate.
The SiC films were tested in an KLA lab with an KLA Nano Indenter G200 utilizing the Continuous Stiffness Measurement option and a DCM head fitted with a Berkovich indenter. Results were achieved using the KLA NanoSuite test method “G-Series DCM Continuous Stiffness Measurement for Thin Films”. This test method implements the Hay-Crawford model to achieve substrate-independent measurements of Young’s modulus.
It should be noted that this method does not correct measurements of hardness for substrate influence. However, hardness measurements are generally less sensitive to substrate influence because the extent of the plastic field is much smaller than the extent of the elastic field. Even when there is a substantial difference between film hardness and substrate hardness, the hardness measured at 20% of the film thickness usually manifests negligible substrate influence.
KLA Nano Indenters have been the industry choice for thin-film testing precisely because of KLA's Continuous Stiffness Measurement option, which measures elastic contact stiffness (S) dynamically. With the Continuous Stiffness Measurement option, every indentation test returns complete depth profiles of Young’s modulus and hardness. Using this option, ten tests were performed on each sample. Loading was controlled such that the loading rate divided by the load (P’/P) remained constant at 0.05/sec; loading was terminated at a penetration depth of 200 nm or greater. The excitation frequency was 75 Hz and the excitation amplitude was controlled such that the displacement amplitude remained constant at 1 nm.
Results and Discussion
Results are summarized in Table 1. Figure 2 shows the progression of elastic analysis for the two samples.
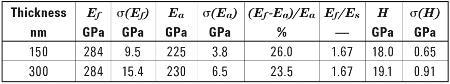
Table 1. Summary of experimental results for SiC coatings on silicon. The true Young’s modulus of the film (Ef) is about 25% higher than the apparent Young’s modulus (Ea) when the indentation depth is 20% of the film thickness.
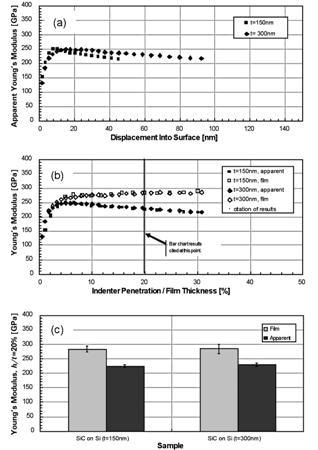
Figure 2. Analytical sequence for the two samples of SiC on Si showing (a) apparent (substrate- affected) modulus as a function of indenter penetration, (b) apparent modulus and film modulus as a function of normalized indenter penetration, and (c) values at 20% of film thickness. Note that in (a) and (b), the trace for each sample represents the average of all tests on that sample. For clarity, error bars spanning one standard deviation are shown only on the bar chart (c).
Figure 2a shows the apparent Young’s modulus achieved by standard analysis as a function of indentation depth. As expected, the Young’s modulus for the thinner sample decays faster as a function of depth. Figure 2b shows both the apparent Young’s modulus (solid symbols) and the Young’s modulus of the film alone (open symbols) plotted as a function of normalized indentation depth.
The fact that the two samples look exactly the same when plotted this way tells us that substrate influence depends strongly on normalized indentation depth. The film modulus calculated according to the Hay-Crawford model is constant out to more than 30% of the film thickness. Finally, Figure 2c shows moduli measured at 20% of the film thickness with error bars spanning one standard deviation. At this normalized depth, the film modulus is about 25% higher than the apparent modulus.
Although these films are thick relative to actual hard disk overcoats, they are not so thick as to nullify the usefulness of the Hay-Crawford model. That is, there is not a sufficiently shallow indentation depth for which results match those returned by the Hay-Crawford model at 20% of the film thickness. In fact, within the top 5 nm, these films manifest a significantly lower Young’s modulus. As a result, the apparent modulus never achieves the value returned by the Hay-Crawford model at 20% of the film thickness. For the thinnest film, the maximum value of apparent Young’s modulus of 249 GPa occurs at a penetration depth of only 9.8 nm, whereas the Hay-Crawford model returns a Young’s modulus of 284 GPa at a penetration depth of 30 nm.
Even if these films were perfectly uniform through their thickness, error and uncertainty increase with decreasing indentation depth due to the combined effects of surface roughness, tip anomalies, environmental noise, etc. Reliability and repeatability increase with indentation depth. Put simply, it is better to measure properties at 30 nm than at 10 nm. The Hay-Crawford model increases the depths at which substrate-independent measurements of Young’s modulus can be made, thus decreasing error and uncertainty.
Figure 3 shows results for hardness. These results have not been adjusted for substrate influence, but as expected, no adjustment is necessary. The hardness reaches its plateau at about 20% of the film thickness.
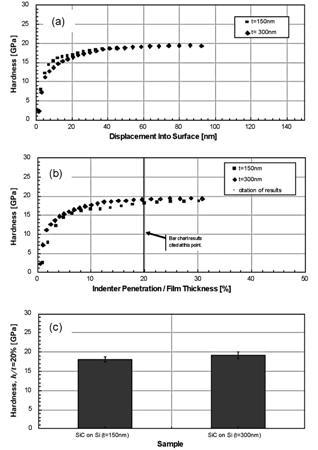
Figure 3. Analytical sequence for the two samples of SiC on Si showing (a) hardness as a function of indenter penetration, (b) hardness as a function of normalized indenter penetration, and (c) values at 20% of film thickness. In these results, substrate influence has not been accounted for, but such accounting seems unnecessary because hardness reaches its plateau at about 20% of the film thickness. Note that in (a) and (b), the trace for each sample represents the average of all tests on that sample. For clarity, error bars spanning one standard deviation are shown only on the bar chart (c).
For hard materials, it is important to remember that hardness is defined as the mean pressure of the contact, or load divided by contact area under load: H = pm = P/A. When the contact is substantially elastic, the Hertzian contact model tells us that the mean pressure (pm) goes as the square root of displacement. Therefore, we should not be surprised that the measured hardness (which we have defined as pm) goes to zero as the displacement goes to zero. This simply means that at these small displacements, the contact is substantially elastic and so the reported “hardness” has little to do with the plastic properties of the film.
Conclusions
The KLA Nano Indenter G200 with a DCM head is the industry choice for these measurements because of its high precision, speed, and ease of use, as well as because of its Continuous Stiffness Measurement option, which delivers properties as a continuous function of penetration depth. In this work, KLA NanoSuite Explorer software was used to implement an analytic model that accounts for substrate influence on the measurement of Young’s modulus. Test methods with this analysis are now available to customers with KLA NanoSuite Professional software.
Having a model that accounts for substrate influence on Young’s modulus affords several practical advantages:
- Reported moduli are for the film alone
- Less user influence because depth range for calculating moduli does not have to be selected “by eye”
- Less uncertainty because results are obtained at deeper penetration depths
Measurements of hardness were not adjusted for substrate influence, but no such adjustment was necessary; for these samples, hardness reaches its plateau at about 20% of the film thickness. This is as expected because the extent of the plastic field is smaller than the extent of the elastic field. Thus, when testing similar materials with a test method that implements the Hay-Crawford model, both the Young’s modulus and hardness should be obtained at an indentation depth that is 20% of the film thickness.
References
- J.L. Hay, “A new model for measuring substrate-independent Young’s modulus of thin films by instrumented indentation,” KLA application note (2010).
- W.C. Oliver and G.M. Pharr, “An improved technique for determining hardness and elastic modulus using load and displacement sensing indentation experiments,” J. Mater. Res. 7(6):1564–1583 (1992).
- J.L. Hay, “Introduction to instrumented indentation testing,” Experimental Techniques 33(6):66–72 (2009).
- J.L. Hay, P. Agee, and E.G. Herbert, “Continuous stiffness measurement during instrumented indentation testing,” Experimental Techniques 34(3):86–94 (2010).
- H. Gao, C.-H. Chiu, and J. Lee, “Elastic contact versus indentation modeling of multi-layered materials,” Int. J. Solids Structures 29:2471–2492 (1992).
Disclaimer: The views expressed here are those of the author expressed in their private capacity and do not necessarily represent the views of AZoM.com Limited T/A AZoNetwork the owner and operator of this website. This disclaimer forms part of the Terms and conditions of use of this website.