Atomic force microscopy (AFM) is a technique used to characterize surfaces at extremely high resolution. A sharp probe is brought into close proximity with the sample to be analyzed. Probe and sample are then moved relative to each other in a raster pattern, and a quantity is measured in a serial fashion at discreet locations (pixels). Figure 1 shows a schematic of a probe in an AFM system.
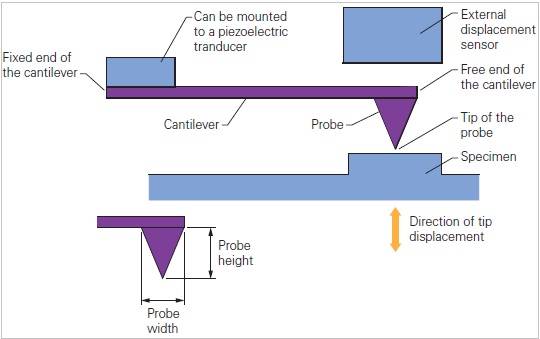
Figure 1. Schematic of the cantilever-tip assembly used in an AFM.
The interactions between the tip and sample surface are measured by monitoring the displacement of the free end of the attached cantilever. There are several schemes to accomplish this. The fixed end of the cantilever can be mounted either static or on a small actuator to enable dynamic imaging modes. The cantilever/probe is part of a modified classical closed-loop feedback system during its operation (see figure 2).
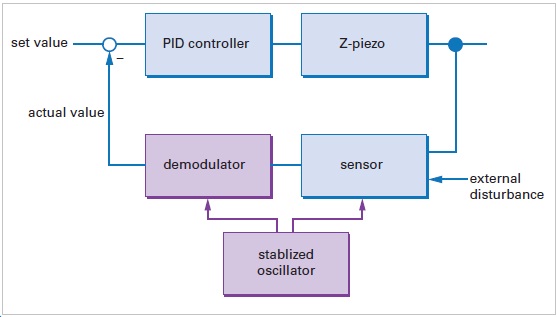
Figure 2. Block diagram of the feedback loop controlling the interaction force in an AFM.
The tip-sample interaction measured through the cantilever displacement sensor is the external disturbance. The magnitude is determined by the user input, the setpoint value. In conventional AFM the setpoint represents the imaging force. The desired setpoint is realized by processing the resulting error signal (or difference between the setpoint and actual value) by a proportional-integral-differential (PID) feedback controller that drives the z-piezo to minimize the error signal.
Contact Mode AFM
Contact mode is not only the easiest AFM mode to understand but also the fundamental basis of additional modes as Scanning Capacitance Mode (SCM), Scanning Spreading Resistance Mode (SSRM), etc. A typical AFM cantilever is shown in figure 3.
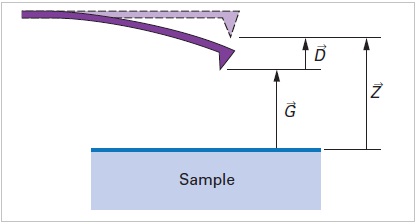
Figure 3. Deflection of a cantilever caused by tip-sample forces
The small (angular) movement of the lever is commonly measured by a laser beam that is reflected off the cantilever and directed onto a split photodetector, as shown in figure 4.
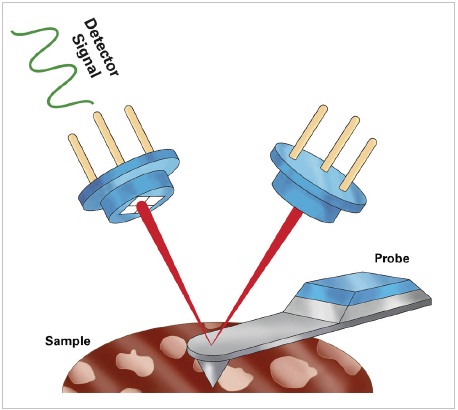
Figure 4. Schematic of light source, cantilever, and photo detector reassembling the basic components of the light-lever AFM detection system.
The force-distance curve is a basic AFM operation to explain contact mode. A schematic of a force curve is depicted in figure 5.
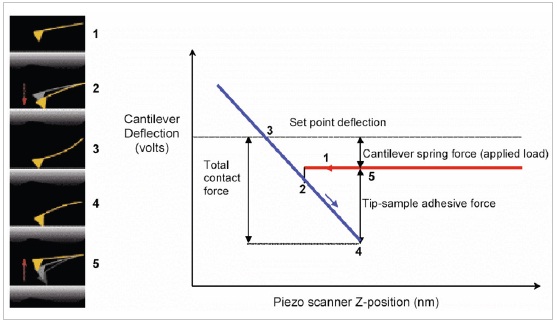
Figure 5. Force distance curve. The approach (red) and withdraw (blue) curves are shown on the right. Note that the total contact force is dependent on the adhesion as well as the applied load.
Force curves in themselves reveal a variety of sample properties, such as adhesion and compliance. The force-volume imaging mode is based on pixel-by-pixel analysis of force curves. But it is not used often due to its slow speed. The most common use of force curves is in combination with any of the forms of SPM imaging in a "point-and-shoot" fashion.
Keeping the setpoint constant while raster scans the tip and sample relative to each other, the contact mode imaging is performed. The drawback here is the lateral force exerted on the sample can be quite high. This can result in sample damage or the movement of relatively loosely attached objects. A solution to that problem was to oscillate the cantilever during imaging, which led to TappingMode Imaging.
TappingMode AFM
The problem of having high-lateral forces between the cantilever and surface very high lateral resolution can be solved by having the tip touch the surface only for a short time, thus avoiding the issue of lateral forces and drag across the surface. This mode was hence referred to as TappingMode AFM.
A typical response curve of a cantilever is shown in figure 6. Typical TappingMode operation is carried out using amplitude modulation detection with a lock-in amplifier.
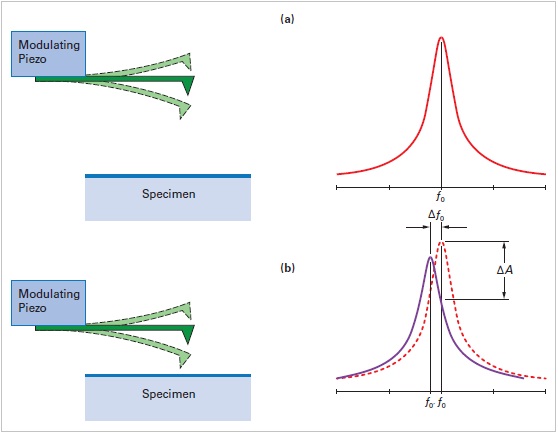
Figure 6. Resonance curve of a TappingMode cantilever above and close to the surface. Note that the resonance shifts to lower frequencies and exhibits a drop in amplitude.
Direct force is not measured in TappingMode. The curve shown in figure 7 is constructed by adding the short-range repulsive and long-range attractive forces.
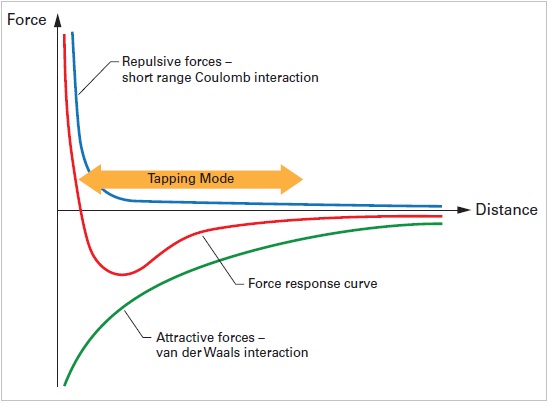
Figure 7. Force curve highlighting the motion of an oscillating cantilever in TappingMode.
The force curve or direct forces between the tip and the sample is not actually measured by the TappingMode AFM while experiencing the interactions. The TappingMode AFM oscillates back-and-forth on this curve, interacting without being in direct control of the force and only an average response of many interactions though the lock-in amplifier is reported.
The reduction of cantilever amplitude can be measured when the tip and sample approach each other. Though this is not detrimental, it restricts the information beyond sample topography that can be gained and unambiguously assigned to a certain sample property.
The inherently unstable feedback situation in TappingMode operation makes it difficult to automate some of the scan adjustments. Forces can vary when going away from a steady-state situation. The higher the tip amplitude, the higher the energy stored in the lever and in the imaging forces. Drift due to temperature changes and/or fluid levels change affects the operation in fluids.
It is essential to adjust the feedback system to achieve reliable information from the AFM. A contact mode scan can be more easily controlled than a TappingMode scan as TappingMode has complex oscillating system.
While past attempts have been made to adjust imaging parameters automatically in TappingMode, there are no other proved method for the broad range of samples commonly studied with AFMs because the TappingMode operates at cantilever resonant frequency, where the cantilever dynamics are relatively complicated.
The tapping dynamics depend strongly on the sample properties. Feedback oscillation for the hard part of the sample can also be caused by a well-tuned feedback loop of the soft part of the sample as optimization of the parameters for every part of the sample is very difficult. Moreover, the long time constant (milliseconds) of the cantilever resonance also prevents instantaneous optimization at each imaging point. The direct force control of contact mode imaging and thus added information available are lost in TappingMode. TappingMode does, however, offer the undeniable benefit of lateral force free imaging, which has made it the dominant imaging mode in AFM to date.
.jpg)
This information has been sourced, reviewed and adapted from materials provided by Bruker Nano Surfaces.
For more information on this source, please visit Bruker Nano Surfaces.