Measuring the band gap of materials is vital in the nanomaterial, semiconductor, and solar industries. This article illustrates how the band gap of a material can be established from its UV absorption spectrum.
The term “band gap” represents the energy variation between the bottom of the conduction band to the top of the valence band; electrons are capable of jumping from one band to another. For an electron to jump from a valence band to a conduction band, it needs a band gap energy - a specific minimum quantity of energy for the transition.
Figure 1 illustrates an image of the band gap.
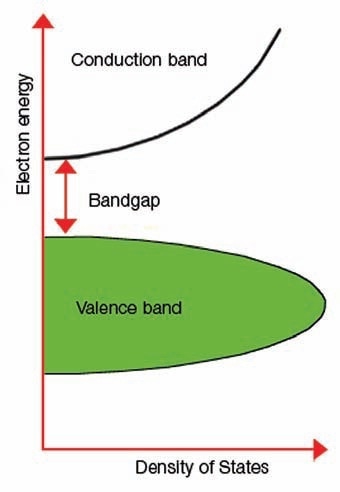
Figure 1. Explanation of band gap.
The measurement of the band gap is vital in the nanomaterial and semiconductor sectors. The insulators’ band gap energy is large (>4 eV); however, it is lower for semiconductors (<3 eV). A semiconductor’s band gap properties can be controlled with the aid of various semiconductor alloys such as InGaAs, GaAlAs, and InAlAs.
A substitute approach is to apply layers of various materials coated onto the silicon base material. This is used in the solar sector in the development of photovoltaic (PV) solar cells. The band gap is crucial because it establishes the part of the solar spectrum a photovoltaic cell absorbs. Wavelengths with energies higher than the band gap of silicon are present on most of the solar radiation that reaches the Earth’s surface. The solar cell absorbs these higher energies, but the difference in energy is transformed into heat and not into functional electrical energy.
As a result, unless the band gap is regulated, the solar cell’s efficiency will be weak. One way to increase the solar cell efficiency is to use layers of varied materials with diverse band gap properties.
In the nanomaterial and semiconductor industries, titanium dioxide (TiO2, usually referred to as titania) is added as a component to coatings. TiO2 is believed to support the internal trapping of light by redirecting or scattering the light reflected from the metallic electrode in to the active layer, and to enhance the transport of charge carriers via the active layer.
Experiment
Many research studies on nanomaterials have been conducted using just a small quantity of the sample. Therefore, sampling becomes a major area of concern in this kind of analysis. A LAMBDA™ 1050 UV/Vis/NIR spectrometer in conjunction with 150 mm integrating sphere (PerkinElmer, Shelton, CT USA) was used to perform the analysis (Figure 2).
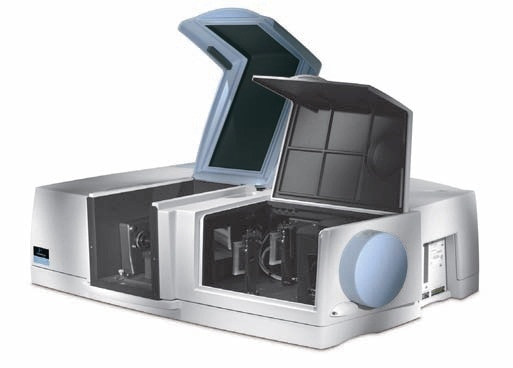
Figure 2. LAMBDA 1050 UV/Vis/NIR System with Integrating Sphere.
This holder (Prama Industries, Mumbai, India – Figure 3) containing a powder sample is fixed to the external port of the integrating sphere. A powder sample press of low volume was utilized. Figure 4 shows the optical diagram of the integrating sphere, and Figure 5 shows 4 shows the UV WinLab™ software setup.
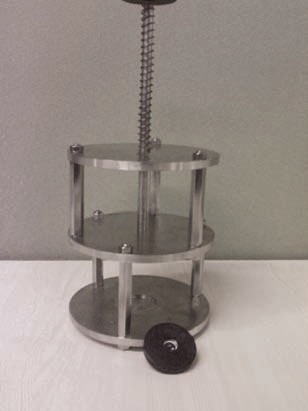
Figure 3. Powder sample press with sample holder.
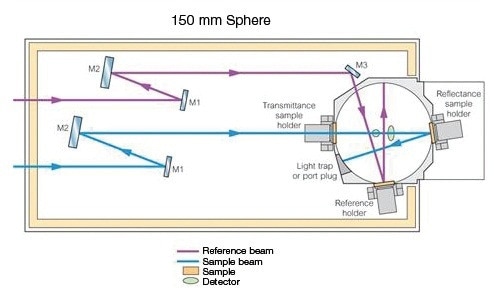
Figure 4. 150-mm Integrating Sphere Optical diagram.
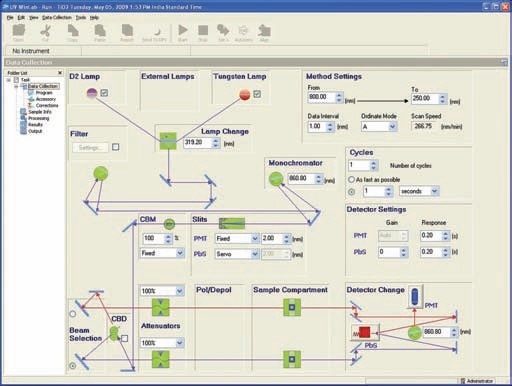
Figure 5. UV WinLab™ software setup.
The sample was run utilizing the parameters listed in Table 1.
Table 1. Instrumental parameters
| Wavelength Range |
250-800 nm |
| SBW |
2 nm |
| Data Interval |
1 nm |
To reduce the specular reflection part, which can cause noise or fringes at the furthest end of the range, the entrance port of the integrating sphere was kept open.
The spectra were recorded in wavelength vs. absorbance and wavelength modes vs. % reflectance.
The benefit of utilizing a LAMBDA 1050 was to have a second sample compartment where the integrating sphere could be placed without hindering the main sample compartment.
Results and Discussion
Figure 6 shows the spectrum obtained on TiO2.
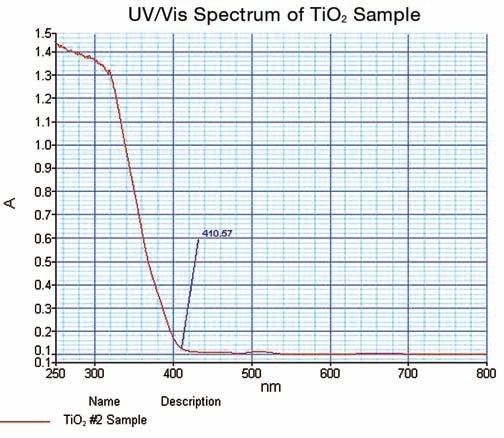
Figure 6. TiO2 UV/Vis spectrum obtained in this work.
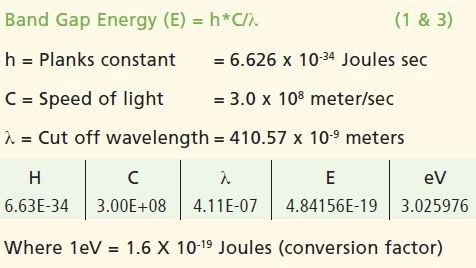
The spectral data thus obtained illustrated the strong cut off at 410.57 nm; where the value of absorbance is minimum. The data is confirmed in the % reflectance mode.
Calculations
Conclusion
Band gap energy values for many powder nanomaterials can be measured using similar type of experimental conditions and accessories. With this, it also becomes possible to determine the quality of TiO2. Several other semiconductor nanomaterials can also be subjected to the experiment, where the example spectra from literature are shown in Figure 7.
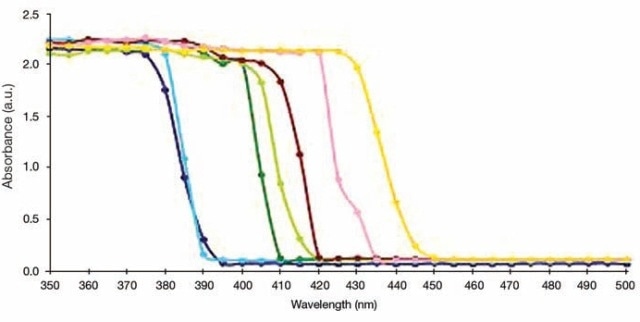
Figure 7. UV/Vis Absorption measurements for TiO2-(X) ZnFe2O4 nanocomposites, where X = Different molar concentration of ZnFe2O4. X = 0.01 (dark green), 0.05 (light green), 0.1 (chocolate), 0.15 (pink), 0.20 (orange). TiO2 Hydrolysis (blue), Pure TiO2 (violet).
The key benefits of utilizing the specifically designed small powder sample holder are:
- The sample quantity needed is 20-30 times less than the traditional powder sample holder
- Smaller quantity powder samples can be tested directly
- Due to a uniquely designed hand press, powder becomes caked in the cup firmly and does not slip in to the sphere
- Cost-effective sampling device with a diameter of 1 cm and a depth of 1.5 cm deep.
- The press provides a uniform surface to the sample to perform reflectance experiments
- Reduces the specular part of the reflection since the sample is being exposed directly to the beam

This information has been sourced, reviewed and adapted from materials provided by PerkinElmer Inc.
For more information on this source, please visit PerkinElmer Inc.