The uptake of metals into individual cells is of importance to both environmental1 and human health2,3 studies, whether the metal is dissolved or exists as nanoparticles (NPs). Cellular metal content is presently studied by removing the cells from their culture media (either by filtration or centrifugation), washing with fresh media solution and then acid-digesting them for analysis by ICP-MS4. This methodology provides the total particle or metal content in a given number of cells rather than on a per-cell basis. As such, the metal concentration of an individual cell depends on the assumption that all cells accumulate the equal amount of nanoparticulate or ionic metal. However, techniques such as transmission electron microscope (TEM)5, scanning electron microscope (SEM)6 and fluorescent tracking7 demonstrate that this assumption is not always true. Although these microscopy techniques enable visualization of NP uptake into cells, they are prone to artifacts and consume a significant amount of time. SEM and TEM are qualitative, and labeling may provide false positives where the label-NP complexes are not persistent.
These limitations (i.e. inability to quantify NP or ionic on a per-cell basis) can be overcome by using Single Cell ICP-MS (SC-ICP-MS), a new technique based on Single Particle ICP-MS (SP-ICP-MS)8,9 ,permitting the examination of larger numbers of cells in a more quantitative and accurate manner. SC-ICP-MS is similar to the SP-ICP-MS technique and is based on the potential to completely ionize a single cell in the plasma and measure the resulting ion content.
One important requirement for both SC-ICP-MS and SP-ICP-MS refers to the ability of the instrument to obtain data at high speed in order to completely capture the signal from the NPs or ionized cell. Dwell times lower than 75 µs are vital for the accurate detection of such events10. With this in mind, SC-ICP-MS allows for the rapid determination of NP or metal content within individual cells (at levels as low as attograms (ag) per cell) and the number of cells containing metal. With knowledge of the total number of cells in a given sample (as determined by flow cytometry or hemocytometry), it is possible to ascertain the percentage of cells containing metal, resulting in increased information available compared to other techniques. With such capabilities, SC-ICP-MS is considered to be a new, powerful technique to quantify the cellular uptake and depuration rates of NPs (or dissolved metals), enabling exposure studies to be performed on a smaller number of cells than possible with other techniques and thus significantly reducing cell expense.
This article focuses on the use of SC-ICP-MS in order to monitor the uptake of ionic and nanoparticulate Au into individual fresh water algae cells (Cyptomonas ovata).
Experiment
Samples and Sample Preparation
Cell cultures were prepared at concentrations of 200,000 cells/mL and exposed to either ionic Au or Au NP (60 nm NPs, NIST 8013) at different concentrations, as displayed in Table 1. Each exposure study was run in triplicate at 20 °C for up to 74 hours with a light:dark cycle of 12 hours light and 12 hours dark.
During the exposure, 1 mL aliquots were removed for analysis in a periodic manner. Before the analysis, the cells were separated from the exposure media and washed three times with media. Each wash cycle involved centrifuging the cells for 15 minutes at 300 g-force and re-suspended in 1 mL of fresh culture media (containing no NP or ionic Au). Figure 1 shows a schematic of the sample preparation cycle. The cell recovery was 43.8 ± 8.6% after the three washes.
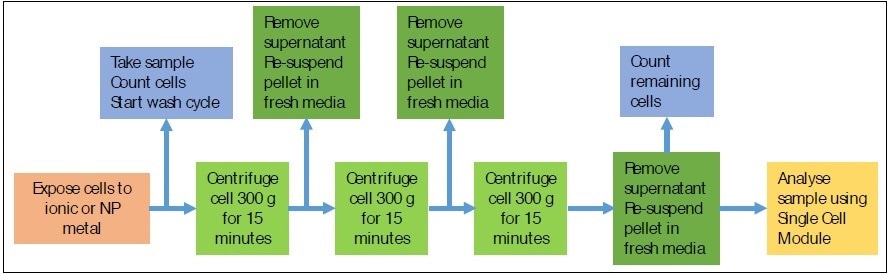
Figure 1. Schematic of sample preparation for SC-ICP-MS analysis.
Instrumental Conditions
All analyzes were performed on a PerkinElmer NexION® ICP-MS using the Syngistix™ Single Cell Application Software Module for data collection and processing11.
Table 2 displays the instrumental conditions used, and Figure 2 shows Single Cell Software Module. Since cells are generally bigger than the aerosol droplets, which are passed to the plasma, a conventional spray chamber confines their transport to the plasma. The new, proprietary Asperon™ single cell spray chamber was used to overcome this limitation. This chamber was particularly developed to increase transport efficiency of cells to the plasma. This is attained by altering the spray chamber design and integrating new flow patterns within the spray chamber. Specifically, a dual make-up gas inlet is placed to develop a tangential flow to the spray chamber walls in order to prevent cells from colliding with and sticking to the walls. Additionally, an inner tube has microchannels where some of the makeup gas is diverted. These channels prevent liquid deposition in the flow path. A laminar flow is finally incorporated for maximum transport of the cells.
Standards
Calibrations were carried out with both ionic/dissolved and NP standards. The ionic calibrations were executed with 1, 2, and 3 ppb Au, and the NP calibrations used 10, 30, and 60 nm Au NPs (NIST 8011, 8012, and 8013, respectively), prepared at 50,000 part/mL. All standards were developed in the algae media to matrix-match the cell suspensions. The 60 nm Au NPs were used to determine transport efficiency.
Table 1. Exposure Studies.
| Treatment |
Cell Concentration (cells/mL) |
Au Ionic Concentration (ppb) |
Au NP Concentration (part/mL) |
| Cell Control |
200,000 |
0 |
0 |
| NP Control |
0 |
0 |
200,000 |
| Ionic/Dissolved Control |
0 |
1 |
0 |
| NP Treatment-1 |
200,000 |
0 |
200,000 |
| NP Treatment-2 |
200,000 |
0 |
400,000 |
| NP Treatment-3 |
200,000 |
0 |
600,000 |
| Ionic Treatment-1 |
200,000 |
1 |
0 |
| Ionic Treatment-2 |
200,000 |
2 |
0 |
| Ionic Treatment-3 |
200,000 |
3 |
0 |
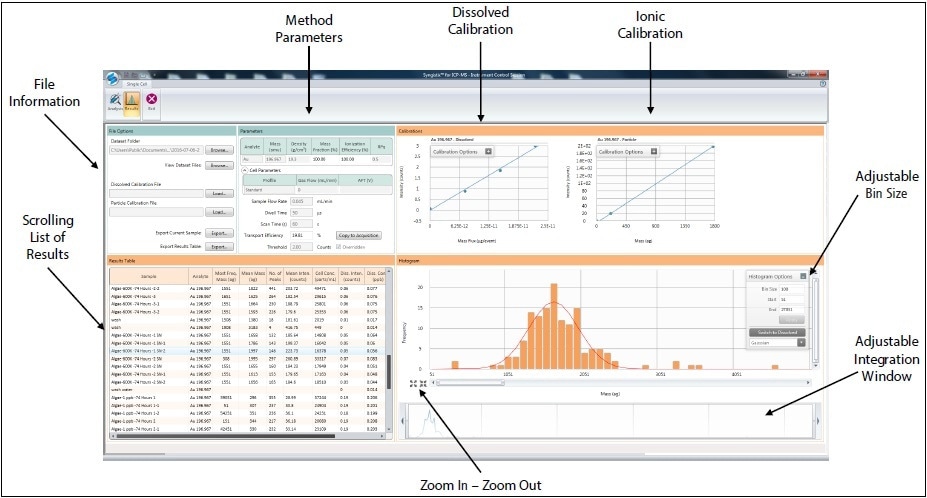
Figure 2. Example of Syngistix Single-Cell Application Software Module.
Table 2. NexION 2000 ICP-MS Operating Conditions.
| Parameter |
Value |
| Sample Uptake Rate |
0.03-0.04 mL/min |
| Nebulizer |
MEINHARD® HEN |
| Spray Chamber |
Asperon |
| Injector |
2.0 mm id Quartz |
| RF Power |
1600 W |
| Nebulizer Gas Flow |
0.36 L/min |
| Makeup Gas Flow |
0.7 L/min |
| Analyte |
197Au |
Results and Discussion
The effect of Au on the cells themselves must be determined before examining the cells for Au NP uptake. This was achieved by exposing cells to varied concentrations of ionic/dissolved gold and different concentrations of Au NPs. This was followed by monitoring the cell concentrations over 74 hours using a hemocytometer. As shown in Figure 3, there was no significant difference in cell concentration between the control and exposed cells for both the ionic (Figure 3A) and NP (Figure 3B) Au exposures. As a result, Au does not affect cell concentrations.
Cell Viability
Cyptomonas ovate is the cell line used in this study, and it has a size range of 20-30 µm. The aspiration of the cells via the nebulizer can subject them to high pressures, which are dependent on the sample flow rate, nebulizer and nebulizer gas flow. A wide range of sample uptake and nebulizer gas flow rates were analyzed by counting the cells before and after the nebulization process using light microscopy in order to ensure that the cells were not damaged during nebulization. Figure 4 shows that 100% of the cells were intact at a sample flow rate of 100 µL/min with a nebulizer gas flow of up to 0.5 L/minute. Thus, all of the cells will enter the spray chamber completely intact under the preferred running conditions.
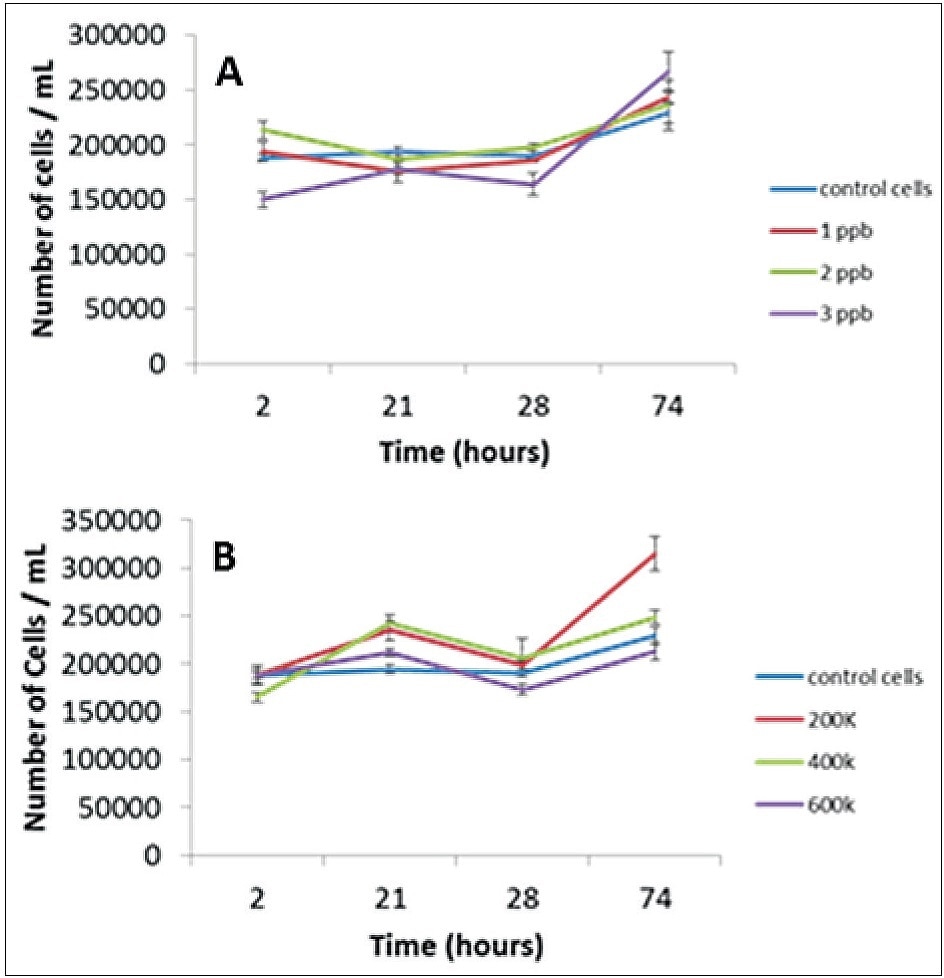
Figure 3. Effect of ionic (A) and NP (B) exposures on cellular concentration.
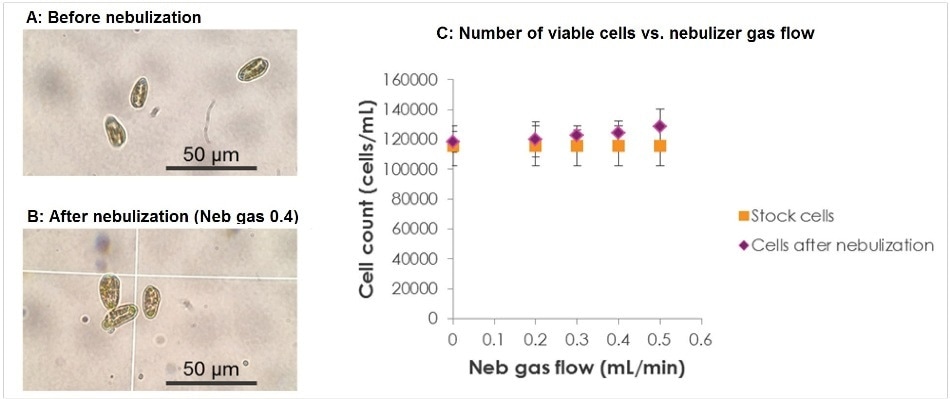
Figure 4. Light microscopy of Cryptomonas ovata cells (A) before nebulization and (B) after nebulization, using a nebulizer gas flow of 0.4 L/min and a sample uptake rate of 0.04 mL/min;. (C) the number of viable (i.e. undamaged) cells before and after nebulization at different nebulization gas flow rates.
Removing NPs from the Cell Media
It is vital to prove that the signal measured from the washed cells is due to the metal inside the cells themselves and not from residual metal left over from the original exposure. Thus, it is important to note that after the final wash cycle, no NPs persist in the cell media. To verify this, the cells were washed three times with fresh media, as shown in Figure 1. The supernatant of each cellular wash cycle was analyzed by SC-ICP-MS in order to monitor the NP content of the media. As shown in Figure 5, the NP content decreases over the three wash cycles in order to reach zero particles detected after the third wash. The table in Figure 5D displays the number of particles counted in each wash cycle. These results highlight that after three washes, it is essential for any signal to originate from the cells themselves.
Since the cell-exposure studies are carried out for more than 74 hours, the studies shown in Figure 5 were repeated at different times over the exposure time. The results always mimicked those in Figure 5, with the size distribution peak of the Au NPs continuing to be constant: no broadening or shifting to smaller or larger sizes was observed, nor was any ionic Au detected. Therefore, NPs are not dissolving or aggregating in the exposure period. The significance of these results is that if the size or size distribution of the NPs from the cells vary from those in the supernatant, then it can be concluded that these variations result from transformations taking place within the cell.
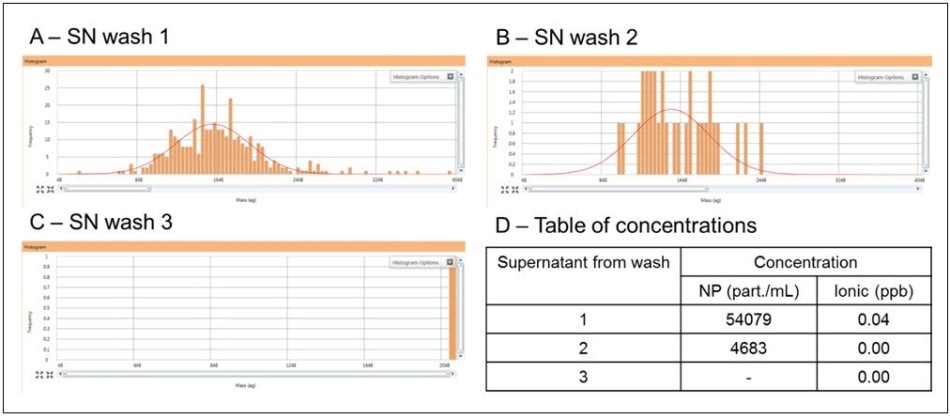
Figure 5. The signal from the supernatant (SN) from the first wash (A), second wash (B) and the final wash (C), along with the numeric NP and ionic concentrations in the three washes (D).
SC-ICP-MS Controls
As shown in Table 1, three control experiments were carried out in SC-ICP-MS on solutions containing only non-exposed algae cells, only algae media and only Au nanoparticles (60 nm, 50,000 part/mL), with typical responses shown in Figure 6. The responses from the cell and media controls (Figures 6 A and B) show that no Au NPs are detected, while the 60 nm Au NIST NPs in media show a Gaussian distribution around 1800 ag/particle (Figure 6 C). Assuming spherical shapes and knowing the molecular mass of Au, 1800 ag correspond to the mass of a 56.26 nm Au spherical NP, which is in agreement with the 56 nm certified TEM value for the Au NIST standard. The particle concentration from this distribution is 49,500 part/mL, which is 99% of the NPs added (50,000 part/mL). These results reveal that any Au measured from the exposure studies results from Au NPs being taken up by the cells and does not originate from non-exposed cells. The results also establish the fact that the algae media does not affect the size distribution of the Au NPs.
NP Uptake into Cells
The ability to determine not just the number of cells that contain NPs, but also the percentage of those cells which contain multiple or single NPs is considered to be one of the main advantages of SC-ICP-MS. In Figures 7 A-D, there is a main peak around 1700 ag which is because of a single NP within the cells (labeled 1NP/1C ≡ 1 particle/1 cell). Since a single 60 nm Au NP corresponds to ≈ 1800 ag (as discussed earlier), then a mass of ≈ 1700 ag Au measured from a cell corresponds to a single 60 nm Au NP in the cell. This small reduction in mass occurs due to the NP being within the cell, which will be explored by microscopy in a future study. As the exposure time increases from two hours (A) to 74 hours (D), the presence of multiple NPs per cell can be seen as peaks appearing at 3400 ag (2 NPs) and 5200 ag (3 NP), marked as 2NP/1C and 3NP/1C in A-C, respectively.
With the potential to determine the number of NPs per cell, the percentage of cells comprising of different numbers of NPs can be tracked over time and as a function of the NP concentration in the algae media. Figure 8 reveals the number of NPs per cell both as a function of time (2 to 74 hours) and as a function of the initial NP concentration in the media solution. As the exposure time increases, the number of cells with 1 NP also increases, as would be expected. Furthermore, a higher percentage of cells comprise of a single NP as the concentration of NPs in the media increases from 200,000 to 600,000 part/mL. A similar trend is observed in the number of cells containing 2 NPs and 3 NPs in the 600,000 part/mL exposure. However, with the 200,000 part/mL, the number of cells that have taken up two or more NPs is extremely small to draw any conclusions with regard to the effect of exposure time on uptake rate.
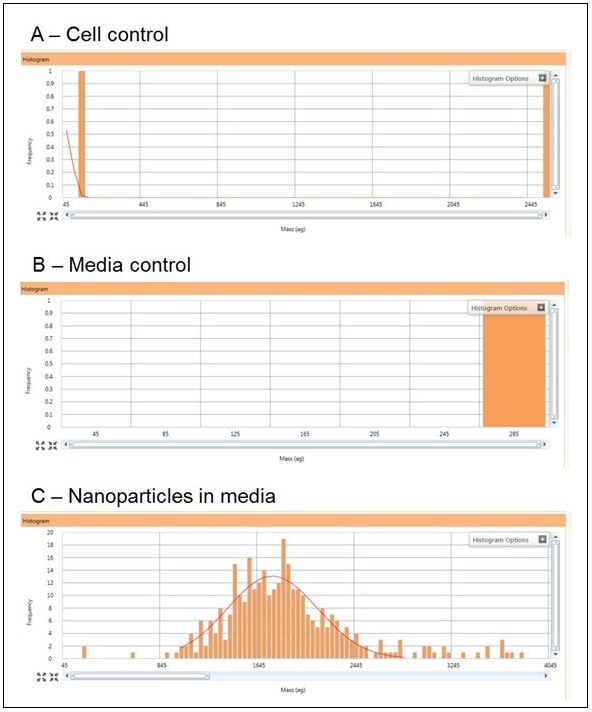
Figure 6. Typical responses for the cell control (A), algae media control (B), and the 60 nm Au NIST control in algae media at a concentration of 50,000 part/mL (C).
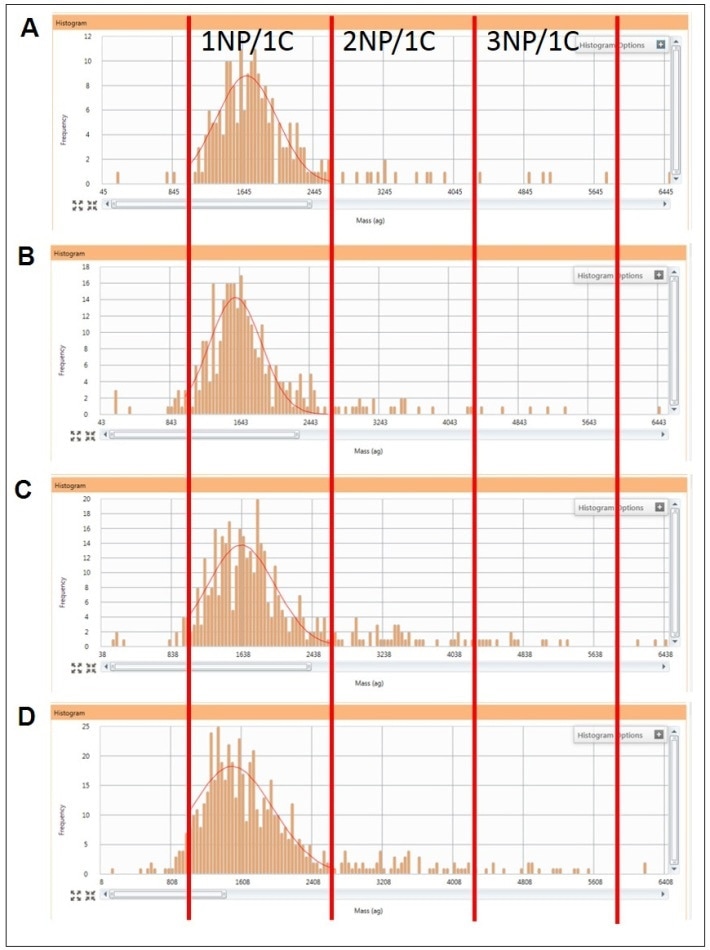
Figure 7. The signal collected from cells showing the increase of cells containing Au metal over 74 hours along with an increase of cells containing more than one particle. Exposure times of 2 hours (A), 28 hours (B), 53 hours (C), and 74 hours (D). 1NP/1C = 1 NP per cell; 2NP/1C = 2 NPs per cell; 3NP/1C = 3 NPs per cell.
Uptake of Ionic Au into Cells
To establish the cellular uptake of ionic Au, algae cells were exposed to dissolved Au concentrations of 1, 2, and 3 µg/L for up to 74 hours, with sample aliquots being drawn at 2, 28 and 74 hours. Figure 9A shows an obvious decrease in the average amount of Au per cell (expressed as ag/cell) over time, which is independent of initial Au concentration. However, as demonstrated in Figure 9B, the % of cells containing Au increases over time and with initial Au exposure concentration. This data implies the existence of a cellular mechanism that limits the amount of Au taken into the cell, which is dependent on the Au concentration in the cellular media.
Conclusion
This article has demonstrated the ability of SC-ICP-MS to measure the concentration of both ionic and nanoparticulate metals in algal cells. The percentage of cells comprising of one NP increases as a function of both exposure and time concentration, while the number of cells containing two and three NPs /cell only increases in the highest initial exposure concentration. However, the amount of Au/cell does not increase with time, when exposed to ionic Au, although the number of cells comprising of Au did increase with time and exposure concentration.
These results show that SC-ICP-MS can, for the first time, quantify the number of cells comprising of metals or NPs and relate exposure concentration to dose. In order to obtain statistically meaningful results, a huge cell population must be studied. In the past, this was extremely time consuming, but with the introduction of SC-ICP-MS, a huge number of cells can be measured within a short period of time. Accuracy is also increased due to the fast data acquisition rates of the NexION ICP-MS, only available with dwell times of less than 100 µs12. With its single cell detection capabilities, the NexION ICP-MS provides a unique opportunity to study the uptake of metals into cells and can also be used to establish the intrinsic metal content of the cells themselves in their natural environment.
The examples provided in this article have considerable implications for the development of regulations governing NP concentrations in the environment. For example, the European Union is considering number concentration as the suitable metric on which to regulate NPs in REACH. No other techniques are presently capable of quantifying these metrics.
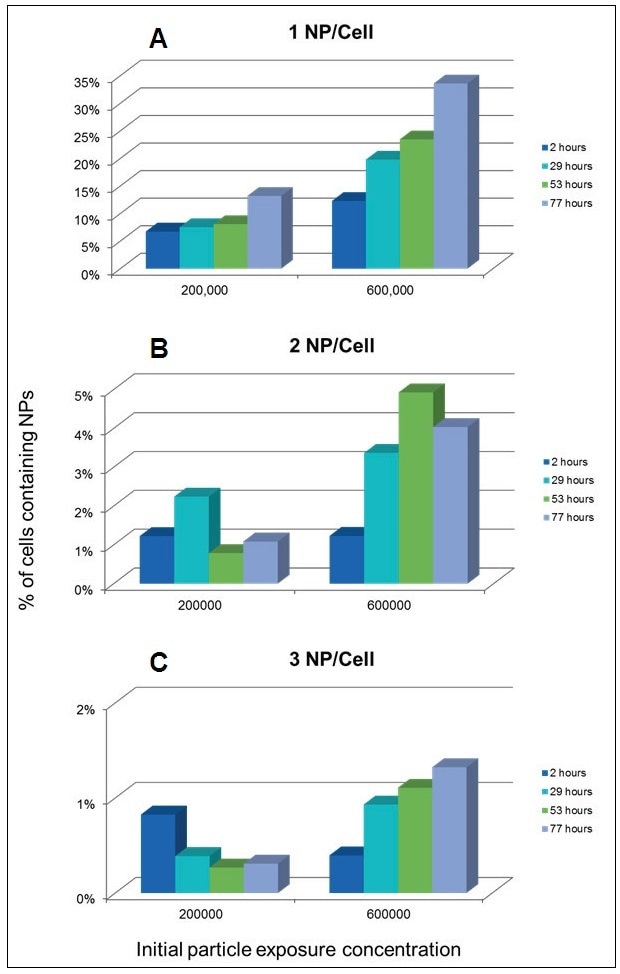
Figure 8. Percentage of cells containing 1 (A), 2 (B), and 3 (C) NPs per cell over time as a functions of NP concentration in the exposure media.
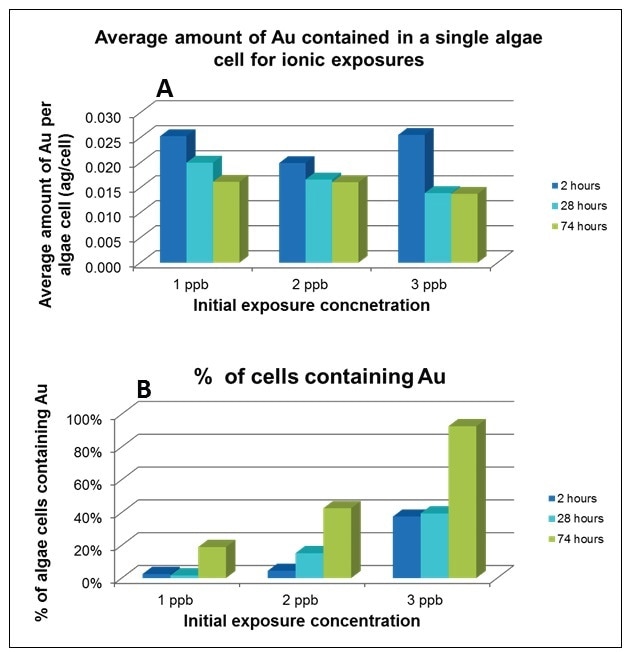
Figure 9. Average amount of Au contained in each cell (A), % of cells containing Au (B). Both studies were conducted at exposures of 1, 2, and 3 ppb Au over 74 hours.
Consumables Used
| Component |
Description |
Part Number |
| Sample Uptake Tubing |
Orange/red (0.38 mm id), PVC, flared, pack of 12 |
N0773111 |
| Spray Chamber Drain Tubing |
Grey/grey (1.30 mm id), Santoprene, pack of 12 |
N0777444 |
| Gold (Au) Stock Standard |
1000 ppm Au, 125 mL |
N9303759 |
| 30 nm Au Nanoparticles |
2.00E+11 particles/mL, 25 mL |
N8142300 |
| 60 nm Au Nanoparticles |
2.60E+10 particles/mL, 25 mL |
N8142303 |
| Sample Tubes |
15 mL, case of 500
50 mL, case of 500 |
B0193233
B0193234 |
References
- Sigg, L.; Behra, R.; Groh, K.; Isaacson, C.; Odzak, N.; Piccapietra, F.; Rohder, L.; Schug, H.; Yue, Y.; Schirmer, K., Chemical Aspects of Nanoparticle Ecotoxicology. Chimia 2014, 68, (11), 806-811.
- Zhao, L. L.; Kim, T. H.; Kim, H. W.; Ahn, J. C.; Kim, S. Y., Enhanced cellular uptake and phototoxicity of Verteporfinconjugated gold nanoparticles as theranostic nanocarriers for targeted photodynamic therapy and imaging of cancers. Materials Science & Engineering C-Materials for Biological Applications 2016, 67, 611-622.
- Akrami, M.; Balalaie, S.; Hosseinkhani, S.; Alipour, M.; Salehi, F.; Bahador, A.; Haririan, I., Tuning the anticancer activity of a novel pro-apoptotic peptide using gold nanoparticle platforms. Scientific Reports 2016, 6, 12.
- Egger, A. E.; Rappel, C.; Jakupec, M. A.; Hartinger, C. G.; Heffeter, P.; Keppler, B. K., Development of an experimental protocol for uptake studies of metal compounds in adherent tumor cells. Journal of Analytical Atomic Spectrometry 2009, 24, (1), 51-61.
- Journal of Physics: Conference Series 522, (2014), 012058.
- Taylor, N. S.; Merrifield, R.; Williams, T. D.; Chipman, J. K.; Lead, J. R.; Viant, M. R., Molecular toxicity of cerium oxide nanoparticles to the freshwater alga Chlamydomonas reinhardtii is associated with supra-environmental exposure concentrations. Nanotoxicology 2016, 10, (1), 32-41.
- Wolfbeis, O. S., An overview of nanoparticles commonly used in fluorescent bioimaging. Chemical Society Reviews 2015, 44, (14), 4743-4768.
- Hineman, A.; Stephan, C., Effect of dwell time on single particle inductively coupled plasma mass spectrometry data acquisition quality. Journal of Analytical Atomic Spectrometry 2014, 29, (7), 1252-1257.
- Montano, M. D.; Olesik, J. W.; Barber, A. G.; Challis, K.; Ranville, J. F., Single Particle ICP-MS: Advances toward routine analysis of nanomaterials. Analytical and Bioanalytical Chemistry 2016, 408, (19), 5053-5074.
- “A Comparison of Microsecond vs. Millisecond Dwell Times on Particle Number Concentration Measurements by Single Particle ICP-MS”, PerkinElmer application note, 2016.
- “Syngistix Nano Application Module for Single Particle ICP-MS”, Product Note, PerkinElmer Inc., 2014. 12. Abad-Álvo, I., Peña Vazquez, E., Bolea, E., Bermejo-Barrera, P., Castillo, J., Laborda, F. Anal. Bioanal. Chem., 2016, 408, 5089.

This information has been sourced, reviewed and adapted from materials provided by PerkinElmer Inc.
For more information on this source, please visit PerkinElmer Inc.