The solution to characterizing particle scattering as a function of UV/Visible spectroscopy is found in the Rayleigh scattering equation represented in Equation 1. Shown below is the generalized form of the Rayleigh light scattering equation for scattering intensity by a particle.
There are a number of factors that contribute to scattering intensity including the scattering angle, the refractive index of the particle, and the distance to the particle. However, in this method, only the two factors of particle size and the wavelength of incident light will be taken into account.
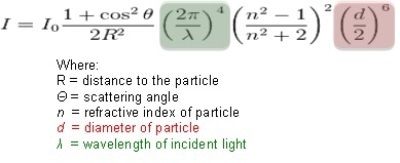
Equation 1: Generalized form of the Rayleigh light scattering equation.
The wavelength of incident radiation (shaded green in the equation above) corresponds to the scattering intensity by the inverse 4th power of the wavelength. Nanoparticle scatter is highly dependent on wavelength; when compared to longer wavelengths (red light), shorter wavelengths (blue light or ultra violet) are scattered much more intensely.
This is the reason behind the sky’s bluish appearance, because of the highly scattered blue light from the atmosphere’s gas molecules. The particle size (shaded red in the above equation) is also important and is associated with a direct proportion of the 6th power of the diameter. In addition, large particle (larger than the incident wavelength of light) scatter is not dependent on wavelength.
Methodology
First, samples are prepared for measurement; liquids are then placed in a cuvette, and creams and gels can be lightly spread on a frosted quartz plate. A UV/Visible instrument (PerkinElmer Lambdas650\750\850\950\1050) fitted with a 150 mm integrating sphere with center mount is used to measure the samples. Then, using a Spectralon plate, the instrument is background corrected and the sample spectra are determined in scatter transmission and center mount mode.
The spectral plan of attack for the problem is shown in figure 1. The visible region from 700 to 400 nm, in green highlight, will be utilized to study absorbance and scattering phenomena. The red highlighted UVA and UVB regions from 400 to 250 nm are the “business end” of sunscreens and SPF rated cosmetics.
Due to the significant absorbance of the carrier medium, the ultra violet region is far more difficult to separate nano and large particle scatter; however, SPF measurements can be measured from center mount spectra as well as scatter transmission. The top, black spectrum is from the center mount, while the bottom grey spectrum is the scatter transmission measurement.
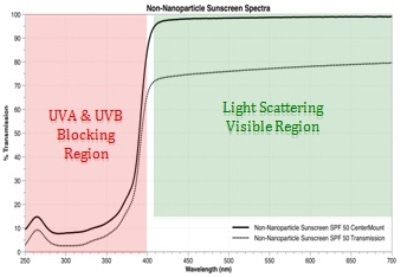
Figure 1: Spectral plan of attack for the problem.
The key instrumental feature is the integrating sphere center mount accessory, which is vital to this analysis. Following are the three relevant points of the analysis:
- In the center mount spectrum, any values under 100%T are due exclusively to sample absorbance only.
- Large particle scattering, from particles greater than 800 nm, causes a wavelength independent % transmission offset in the center mount spectrum.
- All particle scattering, from particles lesser than 800 nm, causes a wavelength dependent curving that increases with decreasing wavelength in the scatter transmission spectrum.
Solution
For a quantitative comparison of scatter and absorbance, it is necessary to get all three values on the same common scale. This can be achieved with the use of spectral areas along with some simple algebra. The general layout is shown in figure 2.
For the sake of simplicity, let us consider spectra as sloping straight lines with the scatter transmission spectrum in brown and the center mount spectrum in blue. The shaded red visible region between 700 and 400 nm is our measurement area and has a greater contribution from 100%T to 0%T of 30,000 spectral area units. All spectral areas are acquired using PerkinElmer’s UVWinLab software.
Sample absorbance, the shaded yellow region illustrated in figure 2, will always be the area between the center mount spectrum to a straight line at a maximum 100 %T. This value can be calculated by deducting the spectral area below the center mount spectrum, shaded blue, from the total visible region area of 30,000 units.
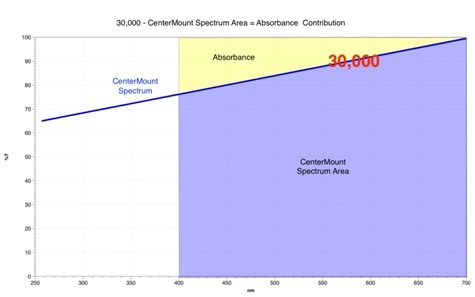
Figure 2: Quantitative comparison of scatter and absorbance.
Calculation of Scattering Components
The large particle contribution will be considered first. The initial step is to calculate a %T extension area boundary from the longest wavelength of the scatter transmission spectrum, indicated by the dotted black line in figure 3.
This line is characteristic of the wavelength independent %T offset because of large particle scattering; hence, it maintains a constant value for all wavelengths in the visible and UV regions.
To calculate the large particle contribution, a subtraction of the %T extension area (shaded brown in figure 3) from the area below the center mount spectrum is carried out. The result is the blue shaded area characteristic of large particle scatter.
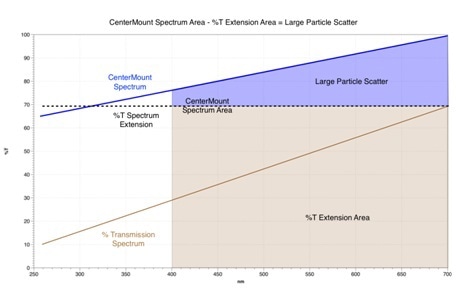
Figure 3: Calculation of Scattering components.
For the small particle scattering contribution, we again utilize the %T extension area from the large particle scatter calculation, dotted black line, and deduct the area beneath the scatter transmission spectrum.
The result is the red shaded small particle area, shown in figure 4. What is being measured is the curvature of the scatter transmission spectrum characteristic of the wavelength dependent small particle scatter.
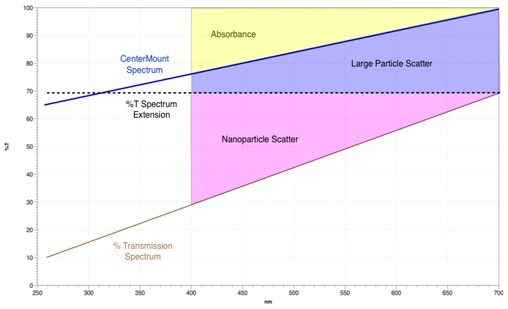
Figure 4: %T Extension Area – Scatter Transmission Spectrum Area = Small Particle Scatter.
Conclusion
Figure 4 shows how all the spectral areas add up, along with their related spectral and calculated boundaries. With this method, it is possible to account for all of the absorbing and scattering phenomena occurring in a normal semi-transparent scattering sample.
The absorbance is depicted in yellow, the small particle (nanoparticle) scattering in red, and the large particle scattering is in blue. The last article, Part 3, in the series will talk about how the above technique can be used in the assessment of cosmetic and sunscreen formulations.

This information has been sourced, reviewed and adapted from materials provided by PerkinElmer.
This article was adapted with kind permission from work provided by Jeffrey L. Taylor and Jillian F. Dlugos from PerkinElmer.
For more information on this source, please visit PerkinElmer.