In the early 1990s, dynamic light scattering (DLS) was introduced as a screening tool for crystallography. Over the past decade DLS has become widely accepted in this role, and dynamic light scattering instruments are now routinely integrated into X-ray crystallography labs. A common misconception however, is that DLS can tell one which samples are likely to yield crystals. In practice, DLS is more appropriately used as a tool for screening out samples that are unlikely to yield crystals. In this article, we address the subtle difference in these points, and examine the value of light scattering techniques as crystal screening tools.
Growth of Protein Crystals
The rate determining step in the resolution of crystal structures is identifying the optimum conditions for high quality crystal growth. There are a multitude of reagents for generating the “soups” from which high quality crystals are grown. However, all the recipes tend to be protein specific, and while modifying a favorite mix to suit a new protein target is the standard approach, more often than not, luck plays a significant role in the generation of high quality protein crystals.
The Second Virial Coefficient
The second virial coefficient (A2) is a thermodynamic property describing the interaction strength between the protein and the solvent. For protein-solvent systems with A2 > 0, the protein “likes the solvent” more than itself and tends to be soluble. When A2 = 0, the solvent is described as a theta solvent, indicating that particle-solvent interaction strength is equivalent to particle-particle interaction strength. When A2 << 0, the protein “likes itself” much more than the solvent, and tends to aggregate into amorphous precipitate. When A2 is just slightly negative however, the conditions are ideal for protein crystal growth at saturating concentrations (Figure 1).
Figure 1. Crystal growth success rate as a function of the 2nd virial coefficient (A2).
Measurement of the Second Virial Coefficient
The 2nd virial coefficient is typically measured using static light scattering (SLS) techniques. The Rayleigh expression used to describe the scattering of light from particles smaller than the wavelength of the incident light is given in Equation 1, where K is an optical constant, C is the particle concentration, M is the weight average molecular weight, A2 is the 2nd virial coefficient, and Rè is the Rayleigh ratio of scattered to incident light intensity.
 (1)
(1)
As evident in Equation 1, KC/Rè should be linear with concentration, with an intercept equal to 1/M and a slope that is proportional to A2.
The Second Virial Coefficient and Optimal Crystal Growth
The use of the 2nd virial coefficient as a screening parameter for optimal crystal growth conditions was first suggest by Wilson et al., who defined the crystallization window as -0.8 x 10⁻⁴ > A2 > -8.0 x 10⁻⁴ (mol mL / g2). This crystallization window or crystal slot is highlighted as zone II in Figure 2, which shows the static light scattering results for lysozyme at different salt concentrations in acetic acid buffer (pH 4).
Figure 2. Debye plots for lysozyme at different NaCl concentrations in acetic acid buffer at pH 4. The grey highlighting in zone II, defines the crystallization slot, where -0.8 x 10⁻⁴ > A2 > -8.0 x 10⁻⁴.
Problems Associated Determination of The Second Virial Coefficient
While crystallographers have enjoyed success using the crystallization window to establish optimal solution conditions, the number of measurements, and hence the time required (upwards of 2 hours), to evaluate A2 for a single solvent can be problematic, particularly for those seeking a high throughput approach to protein crystal screening.
Dynamic Light Scattering
DLS is a technique that is complementary to static light scattering, and can be performed on a time scale measured in minutes rather than hours. In DLS, scattering intensity fluctuations are monitored across µs time scales and then correlated. The intensity fluctuations are a consequence of particle motion, and the measured property in the correlation analysis is the distribution of diffusion coefficients. The size is then calculated using the Stokes-Einstein equation (Eq. 2), where RH is the hydrodynamic radius, k is the Boltzmann constant, T is the temperature, ç is the solvent viscosity and D is the diffusion coefficient.
 (2)
(2)
Dynamic Light Scattering and Particle Size Determination
Figure 3 shows a representative particle size distribution determined using DLS. Since the scattering intensity is ~ proportional to the particle molecular weight, DLS is very sensitive to aggregation and large impurities, even at low concentrations.
Figure 3. Representative DLS intensity particle size distribution.
As such, the technique is ideally suited for distinguishing samples that are unlikely to yield high quality crystals, due to the presence of impurities or non-specific aggregates, i.e. solutions residing in zone III of a Debye plot (Figure 2) where A2 << 0.
Dynamic Light Scattering and Aggregation
Figure 4 shows a comparison of the types of aggregation observed at both high and low concentration for typical protein samples, along with typical size distributions measured using DLS. The rule of thumb target for crystal screening using DLS is ~20% polydispersity (Pd), i.e. if the Pd < ~20% the sample is considered to be an ideal single population with no aggregates present. If the Pd > 20% on the other hand, the presence of non-specific aggregates, various oligiomeric states, and/or impurities decreases the likelihood of high quality crystal generation.
Figure 4. Schematic showing the types of aggregation observed at low and high concentration for typical protein samples. The A2 zones are those detailed in the Debye plots shown in Figure 2, and the size distributions are representative of those measured for each zone at the dilute concentrations used for static and dynamic light scattering measurements. Note that %Pd = (Polydispersity Index)½ x 100.
Dynamic Light Scattering and Crystallization Screening
As shown in Figure 4, DLS can be used to screen 2 out of the 3 solution conditions that are unlikely to lead to high quality crystal growth, i.e. samples with large impurities and samples with A2 < -8.0 x 10⁻⁴ mol mL / g2. In general though, DLS cannot distinguish samples in zone I, where the protein is too soluble to produce crystals, from those within zone II (crystallization slot), where the conditions are optimal for high quality crystal generation. On the other hand, crystal growth is inherently an aggregation process, and as such, researchers are generally probing the boundary between zones II and III, rather than the boundary between zones I and II. So while DLS may not be the silver bullet researchers were hoping it would be, it still fulfils an important role in its ability to screen out samples that are unlikely to produce high quality crystals.
EndoPG I Screening
A common mechanism for the disruption of plant cells by pathogenic microbials is the enzymatic degradation of pectin in the cell wall by EndoPG I, a glycosylated microbial hydrolase. In recent studies, Kato et al. were able to resolve the crystal structures of three forms of EndoPG I from Stereum purpureum – EndoPG Ia, with two sugar chains, EndoPG Ic, with four sugar chains, and De-EndoPG Ia, the de-glycosylated form of EndoPG Ia. The researchers were unable to crystallize a fourth form of the enzyme, EndoPG Ib, with three sugar chains per protein, and reported difficulty in obtaining quality crystals for the EndoPG Ic form of the enzyme.
Dynamic Light Scattering and EndoPG I Screening
The pre-crystal studies for the EndoPG I project included DLS characterization under dilute conditions. The DLS results for the study are shown in Figure 5, which indicates polydispersity values of 7.4%, 14.9%, and 21.2% for the three protein forms where crystals were obtained and 29.1% for the form that failed to produce crystals. These results are consistent with the ~20% Pd rule of thumb for DLS crystal screening.
Figure 5. DLS results (Pd = polydispersity) from the pre-crystal characterization of the four forms of EndoPG I and crystal photos. obtained and 29.1% for the form that failed to produce crystals. These results are consistent with the ~20% Pd rule of thumb for DLS crystal screening.
Zetasizer Nano System
The Zetasizer Nano system from Malvern Panalytical is the first commercial instrument to include the hardware and software for combined dynamic, static, and electrophoretic light scattering measurements. The wide range of sample properties available for measurement with the Zetasizer Nano system include, particle size, molecular weight, and zeta potential.
The Zetasizer Nano system was specifically designed to meet the low concentration and sample volume requirements typically associated with pharmaceutical and biomolecular applications, along with the high concentration requirements for colloidal applications. Satisfying this unique mix of requirements was accomplished via the integration of a backscatter optical system and the design of a novel cell chamber. As a consequence of these features, the Zetasizer Nano specifications for sample size and concentration far exceed those for any other commercially available dynamic light scattering instrument.
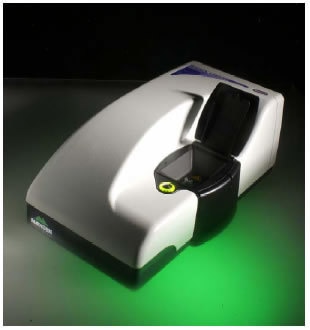
Figure 6. Malvern Panalytical Zetasizer Nano system.

This information has been sourced, reviewed and adapted from materials provided by Malvern Panalytical.
For more information please visit Malvern Panalytical.