Before commencing any nanotoxicological study, it is imperative to know the state of the nanoparticles used, and in particular their size and size distribution in an appropriate test media.
NanoSight have developed a unique instrument for characterizing nanoparticles in liquid suspension. This note discusses the application of this instrument in the characterization of gold nanoparticles and their aggregates in a biologically relevant fluid. Unlike classical light scattering techniques, the Nanoparticle Tracking and Analysis (NTA) technique allows nanoparticles to be sized in suspension on a particle-by-particle basis, allowing higher resolution and therefore better understanding of aggregation than ensemble methods (such as Dynamic Light Scattering, DLS). The study looks at the change in size of gold nanoparticles comparing the case of the standard dispersant solvent (citrate buffer) to a dilute plasma (containing proteins).
Methods and Materials
Human Plasma:
Blood was taken from seemingly healthy donors. The tubes were centrifuged, for 5 min at 800 RCF to pellet the red and white blood cells. The supernatant (the plasma) was transferred to labeled tubes and stored at -80°C. Upon thawing the plasma was centrifuged again for 3 min at 16.1 kRCF to further reduce the presence of red and white blood cells. The supernatant was transferred to a new vessel, taking care not to disturb the pellet.
Particles:
NIST Gold standard nanoparticles of 60 nm were used (NIST reference material 8013). These were stored, prepared and used according to the relevant reports of investigation. The gold was diluted to a concentration of approximately 108 particles/ml using standard citrate buffer of pH=7.19. For the dispersions in plasma, the human plasma was diluted 1:1000000 in citrate buffer, and 10 µl of gold nanoparticles were diluted with 790 µl of the diluted plasma.
Nanoparticle Tracking and Analysis was carried out on a NanoSight LM10. All sample preparation and measurements were carried out at University College Dublin, Ireland and analysis was performed by NanoSight using a beta version of NTA 2.0 software. Multiple videos, each 166s long, were recorded and analyzed in batch mode to ensure statistical invariance. Given that the plasma is a natural ionic medium, it is noted that the issue of protein aggregation will always be problematic.
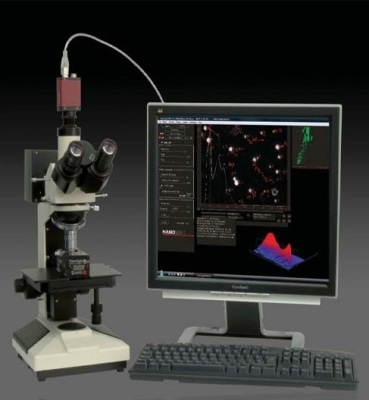
Figure 1. The NanoSight LM10 Instrument.
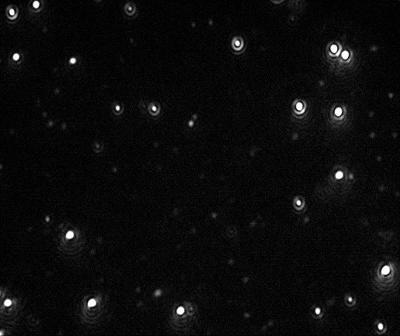
Figure 2. Video image of 60 nm Gold particles as captured by the NanoSight LM10 instrument.
Results
Videos of the nanoparticles were recorded (Figure 2), tracked and analyzed for size when diluted in citrate buffer and in human plasma, and corrected for track length (Figure 3). The measurement of the sample was also made by DLS (Figure 4) and all results are summarized in Table 1.
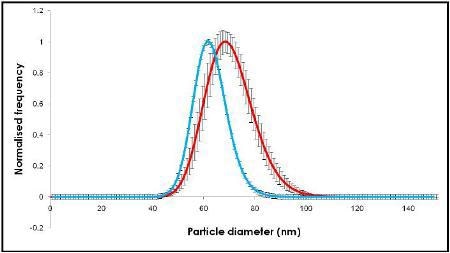
Figure 3. NanoSight results using NTA.
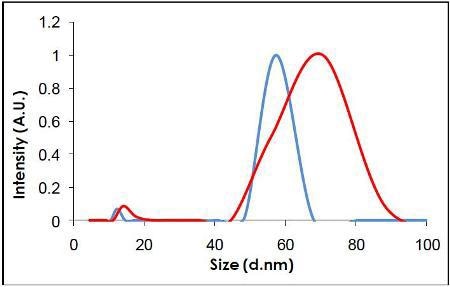
Figure 4. Measurement of the same sample by DLS.
Discussion
The methods for measurement of gold diluted in citrate were as those detailed in the reference materials report. A summary of the results as measured by NIST can be seen in Table 2.
NTA can be used to identify both visually and by a concentration measurement that the particles are still monodispersed adding evidence to the hypothesis that proteins in suspension act to coat the nanoparticles (Figure 5) (and that the increase in size is not due to aggregation). It is not possible to elicit this information purely from the DLS measurement, which is ensemble based.
Figure 5. NTA evidence supports the hypothesis that proteins in suspension act to coat the nanoparticles.
Table 1. Summary of results by NTA and DLS methods.
| Technique |
Material |
Parameter |
Value (nm) |
Error (nm) |
| NTA |
60 nm |
Mean |
61.22 |
0.93 |
| Mode |
60.08 |
1.01 |
| Standard Deviation |
6.57 |
0.92 |
| NTA |
60 nm Gold (plasma) |
Mean |
70.4 |
1.8 |
| Mode |
68.5 |
1.67 |
| Standard Deviation |
9.3 |
0.83 |
| DLS |
60 nm Gold |
Mode |
58.5 |
- |
| DLS |
60 nm Gold (plasma) |
Mode |
70.7 |
- |
Table 2. Summary of results as measured by NIST.
| Technology |
Analyte Form |
Nominal 60nm |
| AFM |
Dry, deposited on substrate |
55.4±0.3 |
| SEM |
Dry, deposited on substrate |
54.9±04 |
| TEM |
Dry, deposited on substrate |
56.0±0.5 |
| ES-DMA |
Dry, aerosol |
56.3±1.5 |
| DLS (173o) |
Diluted liquid suspension |
56.6±1.4 |
| DLS (90o) |
Diluted liquid suspension |
55.3±8.3 |
| SAXS |
Native liquid suspension |
53.2±5.3 |
The change in size recorded in Figures 2 and 3 show an increase in nanoparticle size of approximately 10 nm, corresponding to a 5 nm thick adsorbed protein layer covering the nanoparticle.
Conclusions
There is a significant and measurable change in particle size distribution of monodisperse gold nanoparticles in the presence of a biological medium such as human plasma. A suitable methodology for the measurement of the thickness of the plasma layer using two independent methods, NTA and DLS, have been used to validate one another.
The breadth and mean of the distributions measured by both DLS and NTA is similar to that determined by NIST. In the presence of plasma, both the particle size and the particle size distribution increase slightly. NTA offers the ability to measure absolute concentration which may be used to also give a number concentration of the NIST gold nanoparticles. NTA is also ideal for identifying and counting nanoparticle aggregates such as dimers due to its ability to visualise the nanoparticles individually. It thus represents (for the nanoparticles and concentration regimes used here) a useful tool in the array of techniques available for bionanoscience and bionanointeractions on engineered nanomaterials in biology.

This information has been sourced, reviewed and adapted from materials provided by Malvern Panalytical.
For more information please visit Malvern Panalytical.