Microvesicles (typically in the 100 nm to 1 um range) and nanovesicles, also called exosomes (30-100 nm), were initially believed to be cellular debris. However it is now appreciated that these cell-derived particles are of significant importance and play an important role both in cell to cell communication and cell signalling.
Their importance has recently become recognised since it was discovered that they are present at significantly elevated levels in a number of diseases conditions including coronary artery disease, inflammatory diseases, pre-eclampsia, diabetes and cancer. This raises the question of their direct role in pathogenesis as well as their possible use as biomarkers.
In such circumstance, exosomes are typically present in significantly higher numbers than microvesicles and whilst the process of the formation of these particles is still the topic of debate, their higher concentration makes the characterisation of these smaller particles of potential importance in terms of earlier and more sensitive detection.
Malvern Panalytical offers a laser-based Nanoparticle Tracking Analysis (NTA) system which allows specific microsomal and exosome particles to be directly and individually visualised and counted in liquid in real-time and from which high-resolution particle size distribution profiles can be obtained.
The technique is easy to use, fast, robust, accurate and cost effective, representing an attractive alternative or complement to existing methods of nanoparticle analysis such as Flow Cytometry, Electron Microscopy or Dynamic Light Scattering, DLS (also known as Photon Correlation Spectroscopy, PCS).
Detecting and Counting Exosomes
The NanoSight instrument from Malvern Panalytical offers a unique insight into exosomes in the range of 50 nm - 1000 nm.
The technique is versatile and normally simple dilution is sufficient to measure the concentration of particles present in the sample. Initially the sample can be visually inspected for the presence of larger particles or aggregated material (Figure 1a) following which the user can rapidly generate a high resolution particle size distribution profile and a count (in terms of absolute number concentration) of the vesicles seen (Figure 1b).
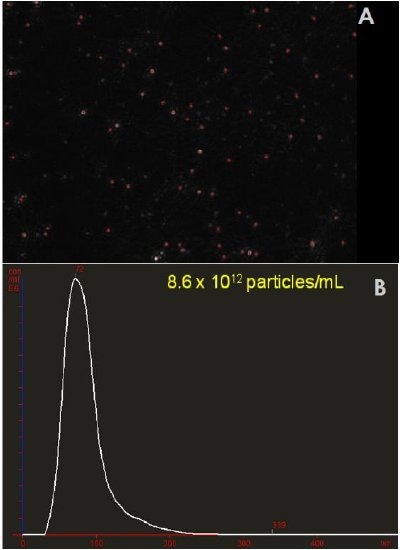
Figure 1. Sample of diluted platelet-free plasma. A) A typical image produced by the NanoSight technique. The image allows the users to instantly recognise certain features about their sample including concentration and level of polydispersity. B) Particle size distribution and calculated original concentration from the sample.
Alternative Techniques
Historically, a number of techniques have been used to characterize microvesicles and nanovesicles with more techniques being available to the micro sized particles.
Analytical Techniques:
- Dynamic Light Scattering (DLS)
- Electron microscopy (EM)
- Enzyme linked immune-sorbent assays (ELISA)
- Flow Cytometry
- Nanoparticle Tracking Analysis (NTA)
Probably the most common of these is Flow cytometry. Commercial flow cytometry typical has a lower size limit of around 300 nm at which point the signal is indistinguishable from the baseline noise level. While this detection limit can be extended with the use of fluorescent labels, at lower sizes the ability to accurately size such particles is severely limited.
Dynamic Light Scattering (DLS) has also been used in this application but being an ensemble measurement, the results comprise either a simple z-average (intensity weighted) particle size and polydispersity or a very limited-resolution particle size distribution profile. Crucially, no particle concentration information is available and DLS cannot measure fluorescently-labelled particles.
Electron microscopy is a useful research tool for studying micro- and nanovesicles but at the expense of capital and running costs, sample preparation and throughput time and sample integrity following sample preparation.
Selectivity of Measurement
Whilst it is frequently adequate to determine merely whether particles of a certain size or size range are present in a sample, it is often much more important to identify and discriminate specific sub-populations of particles within the sample. The NanoSight technique is capable of selectively analysing such populations through, for instance, the use of antibody-mediated fluorescent labelling. This approach allows the user to detect, analyse and count only the specific nanoparticles to which the fluorescently-labelled antibody binds, background non-specific particulates being excluded through the use of appropriate optical filters. While a range of fluorophores can be used, it is advantageous to employ high-efficiency, high stability quantum dot (QDot®) labels for best results.
This is demonstrated in Figure 2A which shows a single video frame of fluorescence light emitted from quantum dots excited with a NanoSight instrument fitted with a blue laser diode. These quantum dots were used to label an antibody (NDOG II) specific to the target biomarker present on a syncytiotrophoblast microvesicle (STBM).
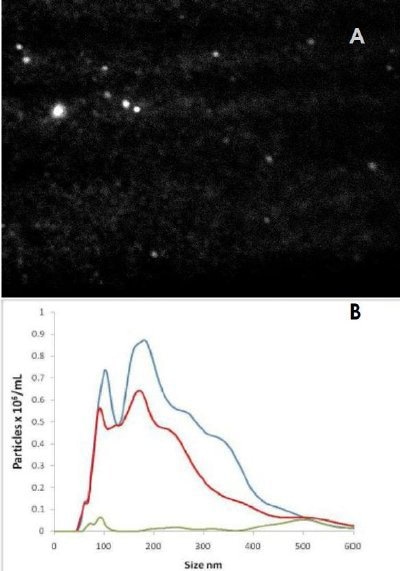
Figure 2. A) Fluorescence image from quantum dots attached via antibody to STBM particles. B) Particle size distributions from scattered light (blue), correct antibody (red) and incorrect (control) antibody (green). Note the number concentration vertical axis.
Figure 2B shows three size distributions showing: i) all particles present in the STBM sample (blue line) as detected by (non-fluorescent) light scatter, ii) the particles to which the fluorescent QDot-labelled NDOG II antibody had bound specifically, as measure under fluorescence mode (red line), and iii) a control (green line) comprising a similarly labelled QDot-labelled antibody with no affinity to the target biomarker on the STBM (also measured in fluorescence mode). This shows that the majority of the particles present in the sample were successfully and specifically labelled by the STBM-specific Q-Dot-NDOG II antibody and that the control successfully showed a very low signal.
Summary
The NanoSight technique from Malvern Panalytical can successfully size and count both microvesicles and exosomes at a low concentration and, when used in conjunction with fluorescent labels, can selectively determine and analyse specific types of particle within a complex sample.

This information has been sourced, reviewed and adapted from materials provided by Malvern Panalytical.
For more information please visit Malvern Panalytical.