According to study results, immunogenicity can be increased by protein aggregates and particles, thereby inducing immune responses to the protein’s monomeric form. The following are the steps followed by biotherapeutic protein manufacturers for the preparation of drugs for injection:
- Protein synthesis and purification
- Lyophylization for stabilization of proteins during transportation
- Reconstitution prior to injection
Although proteins are stabilized during shipment by means of lyophilization, adequate evidence is not available to confirm the existence of the monomeric form of the lyophilized protein after reconstitution. This may lead to the formation of protein aggregates, and even a trace of protein aggregates would trigger the patient show an immune response to the therapeutic course of treatment.
Measuring the degree of aggregation following reconstitution and presenting a histogram of size versus concentration would allow screening these drugs in the formulation stage and confirm the release of the monomer during the reconstitution process with less amount of aggregation.
Particle Counting Methods
The light obscuration technique is used for the USP <729> test to determine the tail of lipid emulsions and the USP<788> test to measure the particulate matter in injections. The particle size limit of classic light obscuration sensors is typically lower down to 1µm, with a concentration limit that is extremely low for most of the protein aggregation samples.
The Entegris AccuSizer FX-Nano System
With the FX-Nano sensor and the LE400 sensor, the new Entegris AccuSizer FX-Nano system (Figure 1) can measure particle sizes of 0.15-0.6µm and 0.5-40µm, respectively. Moreover, the system can work at higher concentration. The use of a focused beam by the new FX-Nano sensor increases its concentration limit by decreasing the total volume analyzed.
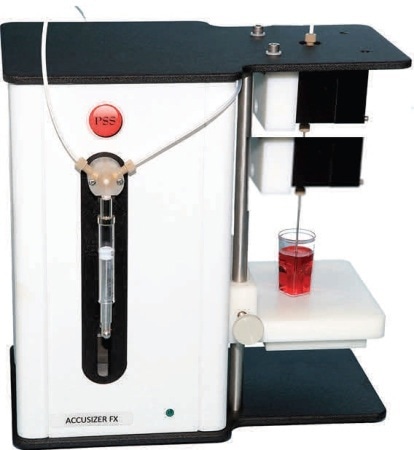
Figure 1. The new Entegris AccuSizer FX-Nano system
The combination of the FX-Nano sensor and the SIS sampler can be worked at sample volumes down to250µL. This setup exceeds the prerequisites of USP <787> Subvisible Particulate Matter in Therapeutic Protein Injections. The two sensors are used to size and count aggregated proteins individually to cover a dynamic range of 0.15-40µm. The Entegris AccuSizer FX-Nano system is a flexible system as the range is 0.5-400µm when the LE sensor is used alone.
Illustrative Examples
This experiment involved the preparation of 1% of Immunoglobulin G (IgG) ( ~150 kDa) in PBS, and the use of AccuSizer FX-Nano equipped with the FX and LE sensors and the SIS sampler to measure the sample undiluted. The results are presented in Figure 2. The Entegris Nicomp 380 dynamic light scattering (DLS) system was also used to analyze the sample and the corresponding results are shown in Figure 3.
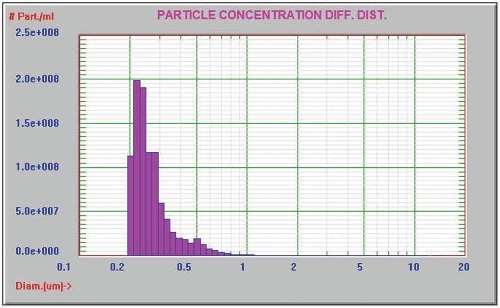
Figure 2. Unfiltered IgG
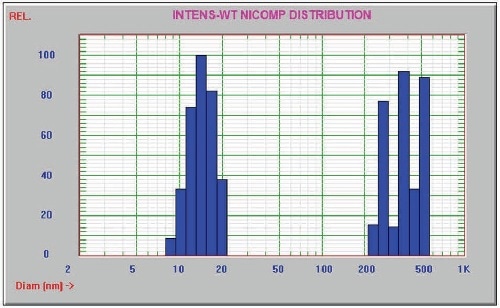
Figure 3. DLS Nicomp 380 data for unfiltered IgG
After filtering the protein sample through a 0.2µm filter, it was analyzed by the AccuSizer FX-Nano system. The comparison results prior to and after filtration are presented in Figure 4. The concentration of the filtered sample is 3.1 x 10⁸ particles/mL when compared to the concentration of unfiltered sample of 9.7 x 10⁸ particles/mL. The AccuSizer FX-Nano system easily identified the reduction in the tail of aggregated particles.
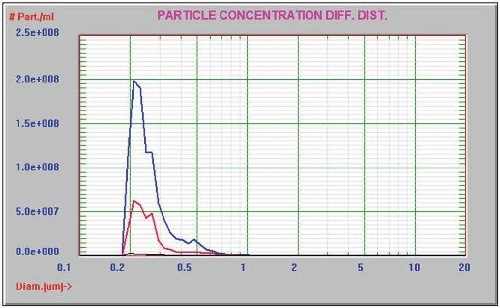
Figure 4. Before (blue) and after (red) filtration
The sample was then analyzed prior to and after one and six hours of incubation at 37°C using only the AccuSizer FX system. The particle size distribution of the sample presented in Figure 5 clearly showed the reduction in the degree of aggregation with increased thermal incubation. The expanded view of the tail of aggregates is illustrated in Figure 6.
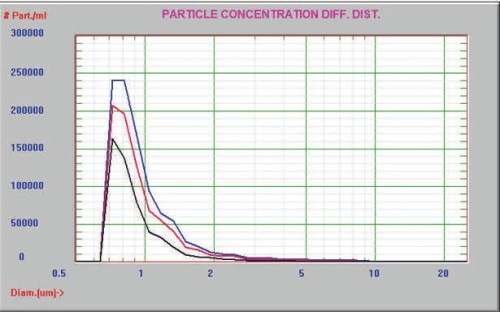
Figure 5. Time 0 (blue), 1 hour (red), and 6 hour (black)
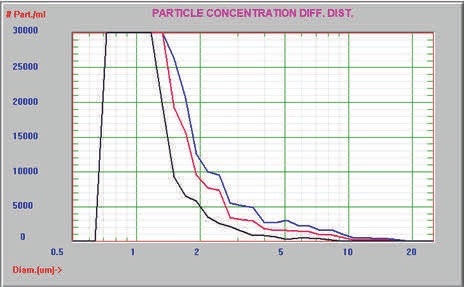
Figure 6. Expanded view of aggregated protein tail
In this experiment, the AccuSizer FX-Nano was used to analyze the buffer and three different preparation/storage conditions of an unknown protein for particle size and concentration measurement of the aggregated protein. Table 1 summarizes the concentration of particles > 0.19µm for the buffer and protein samples, whereas Figures 7 and 8 present the graphical results in the differential count format and cumulative format, respectively.
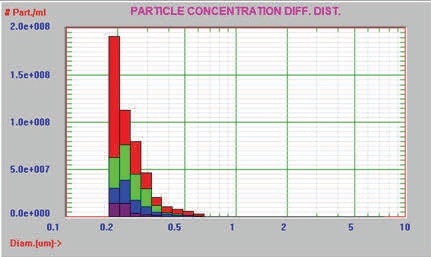
Figure 7. Differential distribution
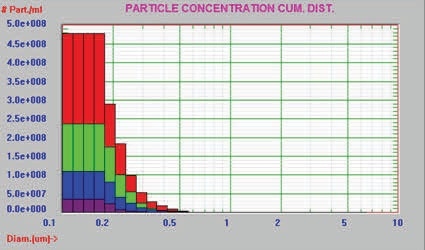
Figure 8. Cumulative distribution
Table 1. Particle concentration of buffer and three protein samples
| Samples |
: |
Particles/mL > 0.19µm |
| Protein A (red) |
: |
4.78 x 10⁸ |
| Protein B (green) |
: |
2.36 x 10⁸ |
| Protein C (blue) |
: |
1.10 x 10⁸ |
| Buffer (purple) |
: |
0.36 x 10⁸ |
The same aggregated protein data are presented in Figures 9 and 10 by plotting the concentration on a long scale for the Y axis to represent the large concentration range of results.
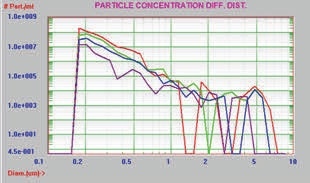
Figure 9. Differential distribution, log scale
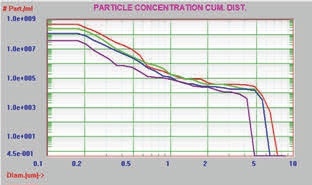
Figure 10. Cumulative distribution, log scale
Conclusion
From the results, it is evident that the size and concentration of protein aggregates can be easily measured using the AccuSizer FX-Nano.
The novel two-sensor method provides an in-depth, high-resolution view of the aggregated protein tail by covering the required broad dynamic range.
In addition, the results of samples at various concentrations can be compared owing to the accurate count/mL data. The small sample requirement of this application can be addressed with the SIS sampler. Furthermore, the removal of the FX-Nano sensor would allow the system to be used for standard USP <787> and <788>particulate matter in injections.

This information has been sourced, reviewed and adapted from materials provided by Entegris
For more information on this source, please visit Entegris