When analyzing multiple samples with dynamic light scattering (DLS) technique, chemists often pipette or pour the suspension into a cell, press the ‘Go’ button, and get a perfect answer within a few minutes. While this is true for monodisperse samples that are dilute and not complicated, it does not apply to all of the samples. This article demonstrates how Nicomp DLS users can navigate through various steps that may be required to produce highly precise and repeatable results.
It is always good to have a systematic approach to making measurements, and it is important to ensure that results are repeatable to make them believable. For example, in a 90 nm PSL standard, the mean value repeatability should be less than 5%, while for a bimodal sample, the mean value repeatability of +/- 15% is satisfactory. The absolute size is also equally important. If results are not within the specified range of repeatability, or fall beyond that range, the following predicted value parameters should be studied:
- The sample itself; has it been contaminated? Was it stored properly, etc?
- Instrument performance; When was a standard last analyzed to verify system accuracy?
- Measurement parameters; How long was the measurement time (should be longer for wider distributions), Was the count rate acceptable(ideally ~ 300 kcounts/sec)? Was the temperature and viscosity entered properly?
- Sample preparation; How was the sample dis-persed? Is the result dependent on concentration?
The above parameters can considerably impact the outcome. This article focuses sample preparation, which is essential to produce accurate and repeatable results. In addition, certain basic supplies, such as solvents, chemicals, surfactants, and an ultrasonic probe for powder dispersion, should be included in a well-organized particle size laboratory.
Powder Dispersion
DLS is only capable of measuring liquid suspensions. So in order to measure powder samples, the samples have to be suitably dispersed into a suspension. The following options may be involved in this step:
- Choice of surfactant - For wetting the powder
- Choice of diluents - Solvent or water
- Mixing or ultrasound, or a combination of both, to aid dispersion
The easiest diluent choice is water, as it is used whenever and wherever possible. An organic solvent may be needed if the sample dissolves in water. Further guidance for diluent preparation is discussed in the following section. If the powder is seen to be floating on the liquid surface (Figure 1), a surfactant has to be used to wet the sample to ensure appropriate dispersion. A powder sample dissolving in the diluent following the addition of a diluted surfactant is shown in Figure 2.
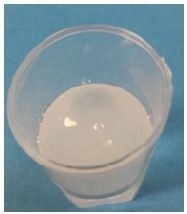
Figure 1. Poor powder wetting
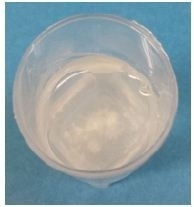
Figure 2. Powder now wetted and dispersed better after adding surfactant.
If the sample is not seen to be floating on the surface of the liquid, surfactants can still be used to aid in sample dispersion. If a known sample is used, an optimum surfactant can be pre-determined (for instance, anionic surfactants can be used for positively charged powder surface). However, a cationic surfactant will bound well to a powder surface that is negatively charged, but these surfactants often depend on pH and are not usually found in standard laboratories. As a result, nonionic surfactants are generally utilized in the case of negatively charged powder surfaces. The best options for most samples are nonionic surfactants, particularly if the powder’s surface properties are not known. Some of the commonly used nonionic surfactants are Igepal CA-630, TritonX-100, Span 20 and Span 80, and Tween 20 and Tween 80. However, such surfactants must be utilized only at low concentrations, to prevent the formation of bubbles. One way is to use filtered DI water to dilute the surfactant to 1-10 vol. %. The quantity of water added depends on the preferred concentration and the overall volume of the suspension. If an ultrasonic probe has to be used for sample dispersion, then a larger total volume would be needed.
Powders tend to form agglomerates. If the individual particle size of these powders has to be measured, then the agglomerates have to be broken apart. Agglomerates can be isolated by applying ultrasonic energy, placing an ultrasonic probe within the sample, or by placing the suspension in an ultrasonic bath. Suitable for highly agglomerated samples, an ultrasonic probe is much more powerful as opposed to an ultrasonic bath. When using an ultrasonic probe care must be taken to make sure that the agglomerates are isolated, but individual particles are not broken.
During sample preparation, the amount of ultrasound energy added against the quantified particle size can be studied. Figures 3-6 show an example of this type of study. Figure 3 depicts the results prior to applying ultrasound, and Figures 4-5 show the outcomes after applying varied amounts of ultrasound. An overlay of no ultrasound vs. 60 seconds of ultrasound is shown in Figure 6.
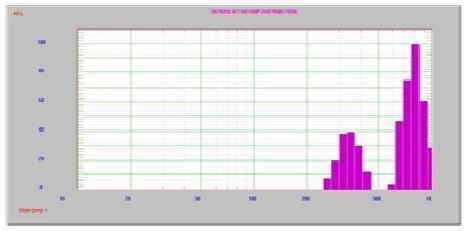
Figure 3. No ultrasound; two peaks at 804 nm and one at 348 nm
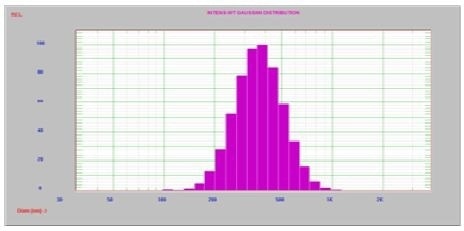
Figure 4. After 30 sec. ultrasound, one peak at 385 nm
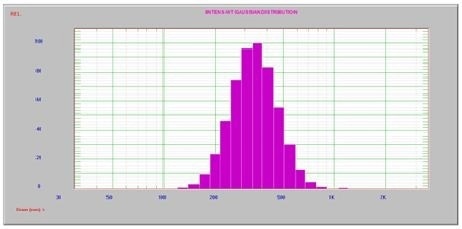
Figure 5. After 60 sec. ultrasound, one peak at 355 nm
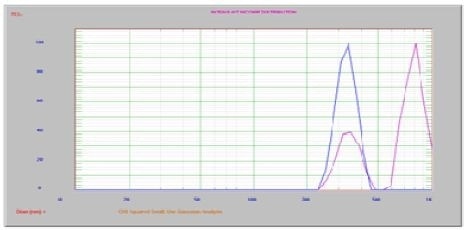
Figure 6. No ultrasound vs. 60 sec ultrasound
During these procedures, the probe’s energy level is kept constant, while changing the time of sample exposure to the probe. Ultrasound pulsing helps to reduce heat accumulation within the sample.
Diluent Selection
Whether organic or aqueous diluent is used, the most important factor is that the diluent should be free of particles. Given that the scattering intensity is proportional to the diameter to the 6th power, several large particles considerably contribute to the overall scattering from the small particle sample. Filtration is the easiest way to eliminate contaminated particles from the diluent. A laboratory DI water filtration system can be used for large diluent volumes, needed for high sample loads. However, 0.2 µm (or better) final filter must be placed at the end. Only the particle concentration, not the megohm-cm rating, is important. A home-made system with different filters in series can be used for the majority of samples.
A clean diluent can be prepared by using a syringe filter. The Whatman Anotop 0.02 µm (Whatman, 6809- 1102) filters are considered to be the highest rated syringe filter, but they are rather costly. To make standard DLS measurements, the Pall Acrodisc 0.8/0.2 µm PN 4187 is generally utilized in Entegris applications laboratories.
Water’s conductivity rating is often not important. In reality, it would be better to utilize a diluent of low salt concentration rather than using pure DI water for samples. This is because the latter can strip ions from the particle surface, bring down the zeta potential, and promote agglomeration. When the 90 nm PSL standard is prepared and used to validate system performance, Entegris uses 10 mM KCl or NaCl water to obtain optimum results.
In order to match ion concentrations and osmolarity in the human body, a number of biological samples are determined in phosphate buffered saline (PBS). In the Entegris applications laboratories, PBS tablets (Sigma Aldrich P4417-50TAB) are simply dissolved in filtered DI water. PBS can be prepared in different ways. While certain formulations lack potassium, others include magnesium or calcium. Table 1 shows the most standard composition of PBS (1X).
Table 1. PBS composition
| Salt |
Conc. (mmol/L) |
Conc. (g/L) |
| NaCl |
137 |
8 |
| KCI |
2.7 |
0.2 |
| Na2HPO4 |
10 |
1.42 |
| KH2PO4 |
1.8 |
0.24 |
First, all salts are dissolved using 800 mL distilled water; HCl is used to adjust the pH and bring it to 7.4; and distilled water is added to an overall volume of 1L. The 1x PBS obtained from this process will exhibit a final concentration of 10mM PO43-, 2.7 mM KCl, and 137 mM NaCl. When working with organic solvents or proteins, other buffers can also be utilized. NaCl, KCl, NaBr, and KBr salts are often used for screening charge interactions in aqueous solution, while DMA, THF and DMF can be used for organic solvents. Different types of buffers containing a pH and salt adjustment can be used to measure proteins. Overall, the aim is to prevent the isoelectric point (IEP) of any sample. The highest zeta potential is seen in lysozyme at less than 4 pH. So measurements of particle size should be highly stable below this level of pH.
Cell Selection
The Nicomp DLS system is supplied with a 10 mm path length glass cell as standard, in addition to a box of 100 round glass cells fitted within a metal cell holder. While disposable 10 mm plastic cells can be used for easy samples, the glass cells provide a better option for low concentration and small size measurements. Care should be taken that no finger prints are left on the cells in the measurement zone. To get optimum results, filtered water should be used to clean the glass cell before use. Figure 7 shows an image of standard cells utilized with the Nicomp DLS system.
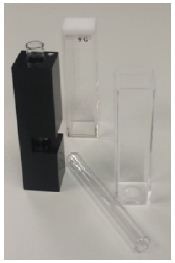
Figure 7. Clockwise starting at the top; 10 mm glass cell, 10 mm disposable plastic cell, round glass cell, round glass cell inside metal cell holder.
Small size, low concentration samples can also be measured by placing a miniature volume cell within a refractive index matching fluid (Acros Organics P/N 12402 or Sigma Aldrich P/N M3516) into a 10mm cell (Figure 8). This is the cell which is used for collecting the lysozyme data at 0.1mg/mL as described in TN 7183.
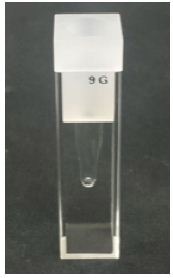
Figure 8. RI matching cell
Removing Large Particles
Users often prefer to determine the smallest particle size in the sample, and not the agglomerates. However, it should be noted that DLS determines the hydrodynamic diameter; a reported diameter sphere will diffuse at the speed derived from the correlation function. Three agglomerated spheres will be measured at three times the size of a single particle. If users are planning to determine the size of a single particle in the presence of agglomerates, then they should remove the agglomerates from the sample. One easy way to do this is to filter out the larger-sized particles. It should be noted that the iltratifon step may considerably reduce the concentration, which is an important aspect as described below.
At the final stage of a measurement, the bottom of the cell should be checked to see whether any large particles have accumulated in the bottom. If these particles are seen at the cell bottom, the result obtained may be not accurate, and would require better sample dispersion.
Concentration Effects
While results are obtained whenever DLS measurements are made, they are not necessarily the best results. Despite the broad concentration ranges given for all DLS systems, it is not possible to determine the samples at preferred concentrations and create precise results.
When determining a sample of unknown origin, a brief experiment can be performed to analyze the effect of concentration on the obtained results. In the case of standard samples, this would involve measuring at concentration A, recording the result, diluting 2:1 with a suitable diluent, calculating, and comparing result B to result A. If the results obtained are the same, then a lack of concentration effect and repeatability have been demonstrated on the measurement. If results are not the same, the sample should be diluted again and the differences must be documented. The lower concentration result is more likely to be precise. According to the ISO standard for DLS, measurements must be carried out at different concentrations, extrapolating to the apparent size at zero concentration. Although this is considered best practice, it is seldom performed or reported.
A number of reasons exist to show that DLS measurements may depend on concentration. Multiple scattering effects take place when light sequentially interacts with separate particles prior to arriving at the detector. Such effects can be minimized by measuring at a backscatter angle through the multi-angle Nicomp system. Another option is to dilute the sample as mentioned above. Particle-particle interactions and hindered diffusion are the other reasons. Such effects become critical as a function of concentration and size, with the negative effects taking place at lower concentrations for smaller-sized particles.
While making measurements on the Nicomp DLS system, the lower concentration limit relies on concentration, particle size, instrument configuration, and relative refractive index particle/diluent. The count rate gives a good indication if sufficient signal is available for good measurements. If a lower count rate is produced by a sample, this can be enhanced by placing the sample in a centrifuge to improve the concentration at the cell end.
Conclusion
The Nicomp DLS system is capable of determining different types of samples in an easy and accurate way. Sometimes, sample preparation is critical to produce accurate and repeatable results. However, there are other factors that can also affect the outcomes, including experimental setup. These include measurement angle, measurement duration, channel width, baseline adjustment, and neutral density filter setting.

This information has been sourced, reviewed and adapted from materials provided by Entegris
For more information on this source, please visit Entegris