Tip-enhanced Raman spectroscopy (TERS) is developing into a powerful method for the nanoscale characterization of bio-molecules. It enables chemical imaging on the scale of single molecules, extending popular and well established methods such as Raman mapping and surface enhanced Raman Spectroscopy (SERS).
Dr Thomas Schmid and co-workers from Professor Renato Zenobi’s group at the Department of Chemistry and Biosciences, ETH Zurich, conducted a study where they demonstrated the application of TERS for label-free chemical characterization of nanostructures in biological specimens.
TERS
The biofilm system selected for the study was based on calcium alginate fibers. TERS provides comprehensive chemical data at very high spatial resolution of < 50 nm, with one major benefit being label-free characterization.
A TERS system essentially combines microscopy, scanning probe, and spectroscopy technologies.
Prof Zenobi’s team began to test the viability of using TERS to conduct label-free chemical characterization of nanostructures inside biofilms. Label-free methods eliminate the challenges of labeling samples using tags or dyes.
Calcium alginate fibers were thought to be a fine representative model for the extracellular polysacharrides of biofilms.
Figure 1 shows a schematic of the setup used. It includes three key subsystems – an inverted confocal laser scanning microscope – CLSM (Fluoview, Olympus), an atomic force microscope - AFM (Veeco Instruments), and a Raman Spectroscopy system comprising of a HoloSpec F/1.8i spectrograph (Kaiser Optical Systems) and an iDus 420 CCD camera (Andor Technology).
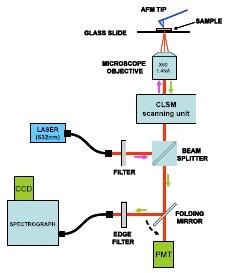
Figure 1. Schematic of the set-up used by Schmid and co-workers for acquisition of TERS spectra.
The excitation laser (532 nm) was delivered through a single mode fiber. The CLSM unit provided the light into the microscope, where it was aimed at the sample with an oil immersion objective (60x and NA=1.4).
Using the same objective, the scattered Raman signal was collected and passed back via the CLSM unit. A beam splitter was then aimed at a multimode fiber, which delivered the signal to the spectrograph’s entrance port.
An edge filter stationed before the spectrograph was utilized to prevent the Rayleigh scattered light from entering the spectrograph. By controlling the x-y stage where the sample was loaded the sample could be scanned in 2D.
A folding mirror in the system allowed fast switching between spectral acquisitions and confocal imaging modes.
Challenges
Many key challenges are encountered when trying TERS with such materials. They are listed below:
- The quality of probe tip - its size, shape, and cleanliness
- Heating effects
- Carbon contamination - either from ambient or photo-decomposition
- Oxygen-mediated photo-bleaching
- Weak Raman activity provided by these specific macro-molecules
- Complexity of the molecules - a large number of functional groups
Normally, a low light regime is used to operate when TERS spectra is collected from a sample made up of a few molecules. Major improvements in the Raman signal are possible by carefully coating the silicon tip with silver.
Typical improvements of ~104 can be obtained. This improvement is linked to two key mechanisms:
- The excitation of surface plasmon modes between the sample and tip, resulting in a multifold increase in the electric field intensity localized at the tip
- Chemical enhancement due to the Charge Transfer (CT) mechanism when the molecules' functional groups are in direct contact with the metal tip
Figure 2 shows the illustrative data, where the background corrected TERS spectra is on the right and an AFM image is on the left. The former were generated when the tip was a few nanometers from the surface (nearfield). However, when the tip was the order of microns from the surface (far-field), it had no spectral signature and no effect was obvious, even with an extended exposure time of 10 minutes.
Schmid and coworkers detected characteristic marker bands for the macromolecules analyzed and noticed shifts in the Raman band positions for these intricate macromolecules, contrary to observations for the corresponding bulk samples of the same material which displayed no shifts.
It also contrasts with less intricate molecules where there was no noticeable shift in the bands for the TERS spectra. They linked the shifting in large part to the impact of chemical enhancement (CE) processes happening at the tip interface.
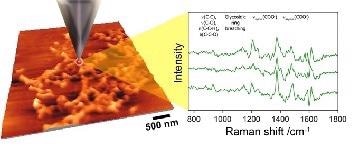
Figure 2. The TERS concept – a metalized tip is used to enhance the Raman response. An AFM image is shown to the left and sample Raman spectra taken from biofilm material is shown to the right. (Courtesy of Prof Zenobi’s group, ETH, Zurich)
Conclusion
When TERS was first applied on alginates, the group effectively demonstrated the gathering of weak Raman spectra at high spatial resolutions from extracellular polymeric substances (EPS) without the need for labeling. Such materials comprise of nucleic acids, polysaccharides, and proteins.
This research signifies an important step towards the development of the TERS method as an accessible, reliable and robust analytic method for several applications in the medical, life science, and materials fields.
Low photon signals promote increased demands on sensitivity of the detector used and the optical system’s collection efficiency. High performance cameras are the only tools that can offer the required signal to noise ratios to make these types of measurements possible.
The suitable system will be able to perform single photon detection - an area where electron multiplying (EM) technology is of a specific benefit. High sensitivity enables the use of lower excitation fluencies, reducing thermal effects sample damage.

This information has been sourced, reviewed and adapted from materials provided by Andor Technology Ltd.
For more information on this source, please visit Andor Technology Ltd.