A significant and continuing goal in the development of flow cytometry methods is the ability to measure more parameters for each particle being analyzed.
Professor John Nolan’s group at La Jolla Bioengineering Institute conducted a study, which was reported by Watson et. al. in Cytometry A. It highlights the development and operation of a Raman spectral flow cytometer (RSFC), which is considered to be a highly radical and challenging method for existing efforts made in spectral flow cytometry.
Raman Spectral Flow Cytometer
Watson and team’s ‘proof of principle’ system combined Raman spectroscopy, via surface enhanced Raman (SERS), and traditional flow cytometry, by replacing a dispersive-optic spectrograph with multichannel detector (CCD), instead of the conventional mirrors/beam splitters, photomultipliers (PMT), and filters of traditional flow cytometers.
They demonstrated a system of adequate sensitivity to obtain and test SERS spectra with ideal spectral resolution from samples comprising of nanoparticle SERS tags attached to microspheres. The system’s functionality and power is revealed using two analytical techniques, principal component analysis (PCA), and virtual bandpass filtering to differentiate between the various Raman species in their test samples.
A major motivation for the team’s work is to enhance the multiplexing potential of cell and particle-based flow cytometry applications. This requires the capacity to access more parallel data channels from the same sample simultaneously.
Traditional systems have been created to provide more simultaneously measureable parameters. Uniquely configured systems with up to 19 parameters are available (side scatter, direct scatter, and multiple fluorescence channels) but this requires numerous filters, PMTs, many lasers, several fluorophore labels, and wavelength selective mirrors.
The issue that arises when attempting to expand such systems to more channels, is the innately wide fluorescence characteristics of the fluorophores in addition to the cost and operating challenges.
When the amount of fluorophore fluorescent bands is increased the bands overlap more, making it more difficult to differentiate the separate signal channels. This restricts the number of potential data channels.
With a dispersive-optic based system, a simpler setup configuration and the prospect of high resolution spectroscopy is possible.
Surface Enhanced Raman Spectroscopy (SERS)
The La Jolla group selected surface enhanced raman spectroscopy (SERS) as a method to access more quantifiable parameters. SERS has unique data-rich narrow band spectral attributes.
Features of the two main technologies are being tapped to develop new methods to flow cytometry. The first uses the ability of silver nanoparticles to improve the Raman scattering intensity of an active species by several orders of magnitude, or as in other research, the use of fluorescent nanocrystals, with their moderately narrow emission bands, as markers of the target species.
The second is the progress of electron multiplication CCD detectors (EMCCD) with their improved sensitivity, which is beneficial when quick spectral rates and short exposure times are a prerequisite. Other groups researching on spectral flow cytometry are focusing on fluorescence signatures for sample characterization. Some of these groups employ avalanche photodiodes (APD) or multianode PMTs rather than CCDs for the detectors.
Figure 1 displays the flow cell and the interaction region, where the laser excites the cells or sample particles.
Figure 2 shows a schematic of the RSFC instrument, revealing the key components employed: the laser and its delivery into the flow cell (FC) with focusing optics (A); the detection of the Rayleigh side scattered signal, gathered by lens optics (C) into an optical fiber (OF) and supplied to a photomultiplier (PMT); the SERS signal collected (B) and combined to an optical fiber linked to a spectrograph with long pass filter (LP) to remove the Rayleigh scatter at the laser wavelength; the spectral data is captured by a Newton EMCCD camera; a photodiode was used to detect the forward scattered data that also served to supply triggering for acquisitions by the camera.
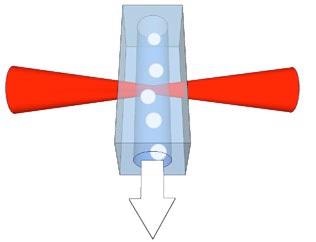
Figure 1. Schematic of the particles in the fluid flow and interaction region of the laser within the flow cell.
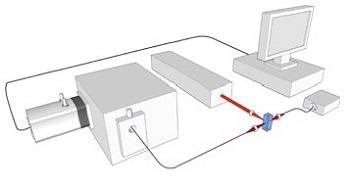
Figure 2. Schematic of RSFC instrument
Their test samples were made up of glass-encapsulated SERS tags, attached to the surface of polystyrene microspheres. Four different Raman reporters were used during the preparations, each offering its own characteristic Raman signature.
After tagging each microparticle to one of the four Raman reporters, data was captured for each particle as it passed via the interaction region (Figure 1) in the form of a Raman spectrum, typical examples are illustrated in Figure 3.
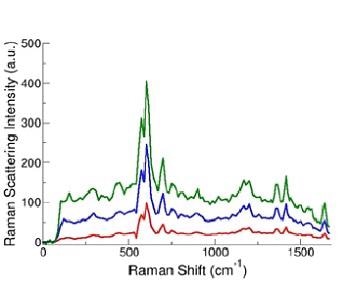
Figure 3. Sample SERS spectra from SERS tag-labeled microparticles. (D. Sebba and J. Nolan, unpublished data)
Evidently, there is a potential for valuable data from the sharp and highly resolved spectral features of these spectra compared to the broadband data attainable with the conventional filter systems or spectral methods using fluorescent markers.
Virtual Bandpass Filtering and Principal Component Analysis
Next, Watson et.al. started to demonstrate two powerful techniques to test their data to distinguish between the four different types of microparticles. The first method, known as ‘virtual bandpass filtering’, is similar to the real-time filtering bandpass methods of traditional flow cytometry.
It provides the chance to characterize ‘optical filters’ to specific regions from the SERS spectra to highlight differences between the four different types of particle, resulting in the derivation of a new set of parameters for comparison function. A positive aspect of this technique is the flexibility for optimization, through readjustment of the virtual bandpass regions as well as the characterization of the number of new parameters to be used.
Conversely, Watson et.al. indicate that this method becomes complex and difficult as the number of SERS tags increases, with their related density and overlap of spectral attributes.
Principal component analysis (PCA) was the second technique used to differentiate the four SERS tags. PCA was used on the first order derivative that was measured from the smoothed, normalized SERS spectra; the capacity to differentiate between different types of SERS tags was established with this advanced and proven analysis method.
Conclusion
The application of a spectrograph with spectral deconvolution algorithms has the potential for a more detailed and flexible approach to multi-parameter or multicolor analysis. The La Jolla group has created this system as a recent addition to the tools of flow cytometry - the Raman spectral flow cytometer (RSFC).
There are still some challenges to be addressed in terms of sensitivity and speed while still maintaining quality resolution. Developments in digital processing speeds and camera acquisition rates will enable quicker analysis rates – a chief requirement of advanced flow cytometry. These challenges will be soon addressed; the potential advantages in terms of biological applications are huge.

This information has been sourced, reviewed and adapted from materials provided by Andor Technology Ltd.
For more information on this source, please visit Andor Technology Ltd.