Carl C.L. Schuurmans, Jan-Piet Wijgergangs, Ad Gerich, Rut Besseling, InProcess-LSP The Netherlands
Nanoparticles based on Titanium dioxide (TiO2) have many commercial applications, and of all engineered nanoparticles (NPs), the scale of their industrial production is the largest globally.
The size of TiO2 NPs is one of the most important production/processing quality criteria. Currently, the size of TiO2 NPs in high concentration nanosuspensions is determined through offline analysis of samples taken from ongoing processes. These dilution-based measurements are necessary due to the strong scattering of light of TiO2 and can cause production delays and require laborious, expensive, complex, and error-prone sample handling. In this white paper, we show the ability of the Nanoflowsizer to measure particle size distributions (PSDs) of undiluted, highly turbid TiO2 nanosuspensions. The Nanoflowsizer is a process analytical tool based on spatially resolved dynamic light scattering technology (SR-DLS). The spatial resolution allows automated selecting of information-rich single scattered light from strongly scattering nanosuspensions such as those based on TiO2 NPs. Specifically, we demonstrate the ability of the Nanoflowsizer to continuously monitor TiO2 particle formation via a sol-gel approach and determine the Zav, D10,50,90, and the particle polydispersity index (PDI) at any point during particle synthesis. Importantly, using the Nanoflowsizer, synthesis failure conditions can be detected in real-time, for instance through increases in the measured D90. Finally, we discuss the benefits of implementing the Nanoflowsizer in NP research and development, industrial processing, and quality control environments.
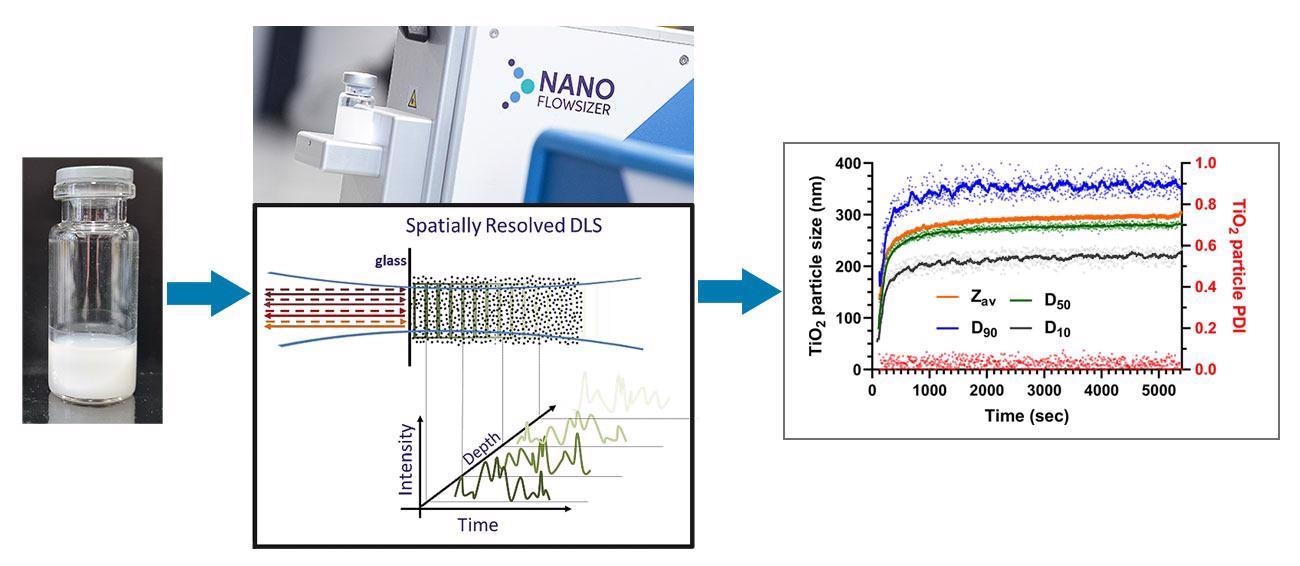
Image credit: InProcess LSP
Titanium dioxide nanoparticles – commercial applications and processing challenges
Nanoparticles based on titanium dioxide (TiO2 NPs, size ranging between 1-1000 nm) are indispensable in modern society. Currently, TiO2 NPs find commercial use in construction, personal care products, food applications, coatings, paints, ceramics, and wastewater treatment [1–5]. Worldwide production of TiO2 NPs was estimated in 2012 to be up to 10.000 tons per year, making it the most produced engineered nanomaterial globally[6]. Other studies expect the production of TiO2 nano-particulates to increase exponentially to an incredible 2.5 million tons per year in 2025, based on the assumption that nano-sized TiO2 will completely supplant the industrial production of bulk TiO2 for similar commercial applications[7].
However, the current global commercial success of TiO2-based NPs comes with some challenges in its controlled production, especially regarding the rapid determination of TiO2 particle size. To explain, most conventional NP sizing instruments are based on optical techniques such as Dynamic Light Scattering (DLS) or laser diffraction, that measure particle size from the characteristics of light scattered from a suspension of NPs. Titanium dioxide has a very high refractive index (RI) ranging from ~2.0-2.8 for visible wavelengths, depending on its structure and density [8,9]. Due to this high RI, the scattering from TiO2 NP suspensions can be very strong. This in turn causes relatively low concentrations of TiO2 nanosuspensions to already become highly optically turbid, leading to unfavorable effects for optical particle size determination, such as multiple light scattering and a high extinction coefficient. Due to these limitations, TiO2 nanoparticle size (quality) control during or after processing can become a laborious, often expensive task, requiring skilled lab personnel performing manual sampling and extensive sample dilution before a proper analysis can be obtained.
To monitor TiO2 (and other) nano-synthesis processes more effectively and efficiently, via direct, inline size analysis, InProcess-LSP (a Dutch Process Analytical Technology [PAT] company) has invented and commercialized a new technology for NP size characterization in highly turbid suspensions without the need for diluting. This technology, termed Spatially Resolved Dynamic Light Scattering (SR-DLS), not only provides rapid real-time sizing of highly turbid nanosuspensions, but also allows to perform such analysis for many different sample/process environments and during suspension flow, offering the desired inline NP sizing capability. Currently, an instrument based on SR-DLS (the Nanoflowsizer) is commercially available and provides automated TiO2 particle sizing in concentrated, turbid, and flowing suspensions during both particle formation and processing.
The importance of PAT in nanosuspension production and processing is not to be underestimated [10]. Integration of the Nanoflowsizer into NP production facilities will allow real-time accurate monitoring of particle size without any sampling or laboratory analysis. The automation of the characterization process provides significant efficiency benefits. In addition, upon implementation of the Nanoflowsizer into a process, it will no longer be strictly necessary to maintain a dedicated laboratory infrastructure for particle sizing. Reducing the need for such infrastructure can potentially cut costs related to particle characterization significantly.
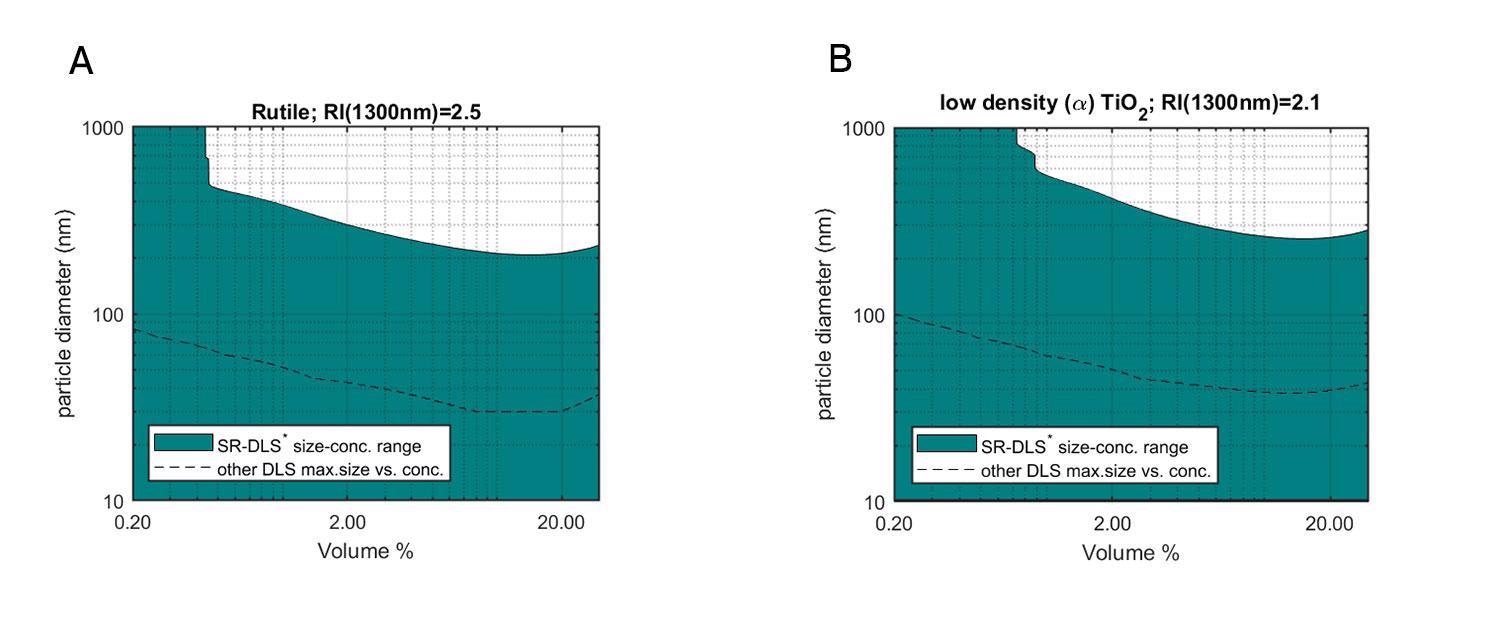
Figure 1A: Size-volume fraction range of Rutile-TiO2 particles that can be measured by the NanoFlowSizer (green), as calculated using Mie theory taking the bulk RI of Rutile and the maximum sample turbidity (~50mm-1) accessible for NFS SR-DLS measurements. The dashed line shows the maximum size for standard DLS (see ‘Methods’ for details). 1B: Same as 1A, but for low-density TiO2 particles with a reduced RI of 2.1.
The benefits of the SR-DLS technology for highly turbid suspensions are best observed through a direct comparison with conventional DLS. In figure 1A and B, the range in which TiO2 NPs (rutile and amorphous, respectively) dispersed in water can be measured is shown as a function of particle size and volume fraction. The dark green areas represent the range of TiO2 particle sizes and concentrations that can be measured with the Nanoflowsizer, whereas the dashed line indicates the upper limit of conventional DLS-based technologies (calculated for a laser wavelength of ~640nm). Clearly, SR-DLS is able to measure much larger TiO2 particles in much more concentrated samples, exceeding the maximum size or concentration accessible in regular DLS by a factor 10 or more, and allowing particle sizing for hitherto impossible combinations of NP size and concentration[1].
In this white paper, we show that highly turbid TiO2 nanosuspensions can be easily measured using SR-DLS technology. Specifically, SR-DLS technology allows determination of TiO2 particle size characteristics such as the Zav, D10,50,90 and the particle PDI, either in a continuous fashion during a particle production process or as a single point determination, without sample dilution steps.
Spatially resolved dynamic light scattering and the Nanoflowsizer
Typically, measurements of NP size distributions in dispersions require sampling from a process fluid, sample preparation and analysis off-line. For instance, a standard DLS measurement records fluctuations in scattered laser light due to the Brownian motion of the suspended NPs. The frequency of these fluctuations reflects the particle diffusion coefficient D which provides the NP diameter, d, (and size distribution) via the Stokes-Einstein relation, D = kBT/(3π d ɧs) [11]. Here, kB is the Boltzmann constant, T the temperature and ɧs the solvent viscosity. Conventional DLS-based measurements can only be done using sufficiently dilute nanosuspensions. This NP concentration limit is required to ensure that the detected photons have only been scattered by the NPs once, as multiple scattered light contributions complicate and bias the analysis of particle diffusion. In addition, traditional DLS can hardly be employed for flowing suspensions, requiring instead stagnant fluids and static measurements. As a result, measuring nanosuspensions in the state one would normally encounter them in a process or synthesis (i.e. highly concentrated, turbid and/or flowing) is not possible using standard DLS[12].
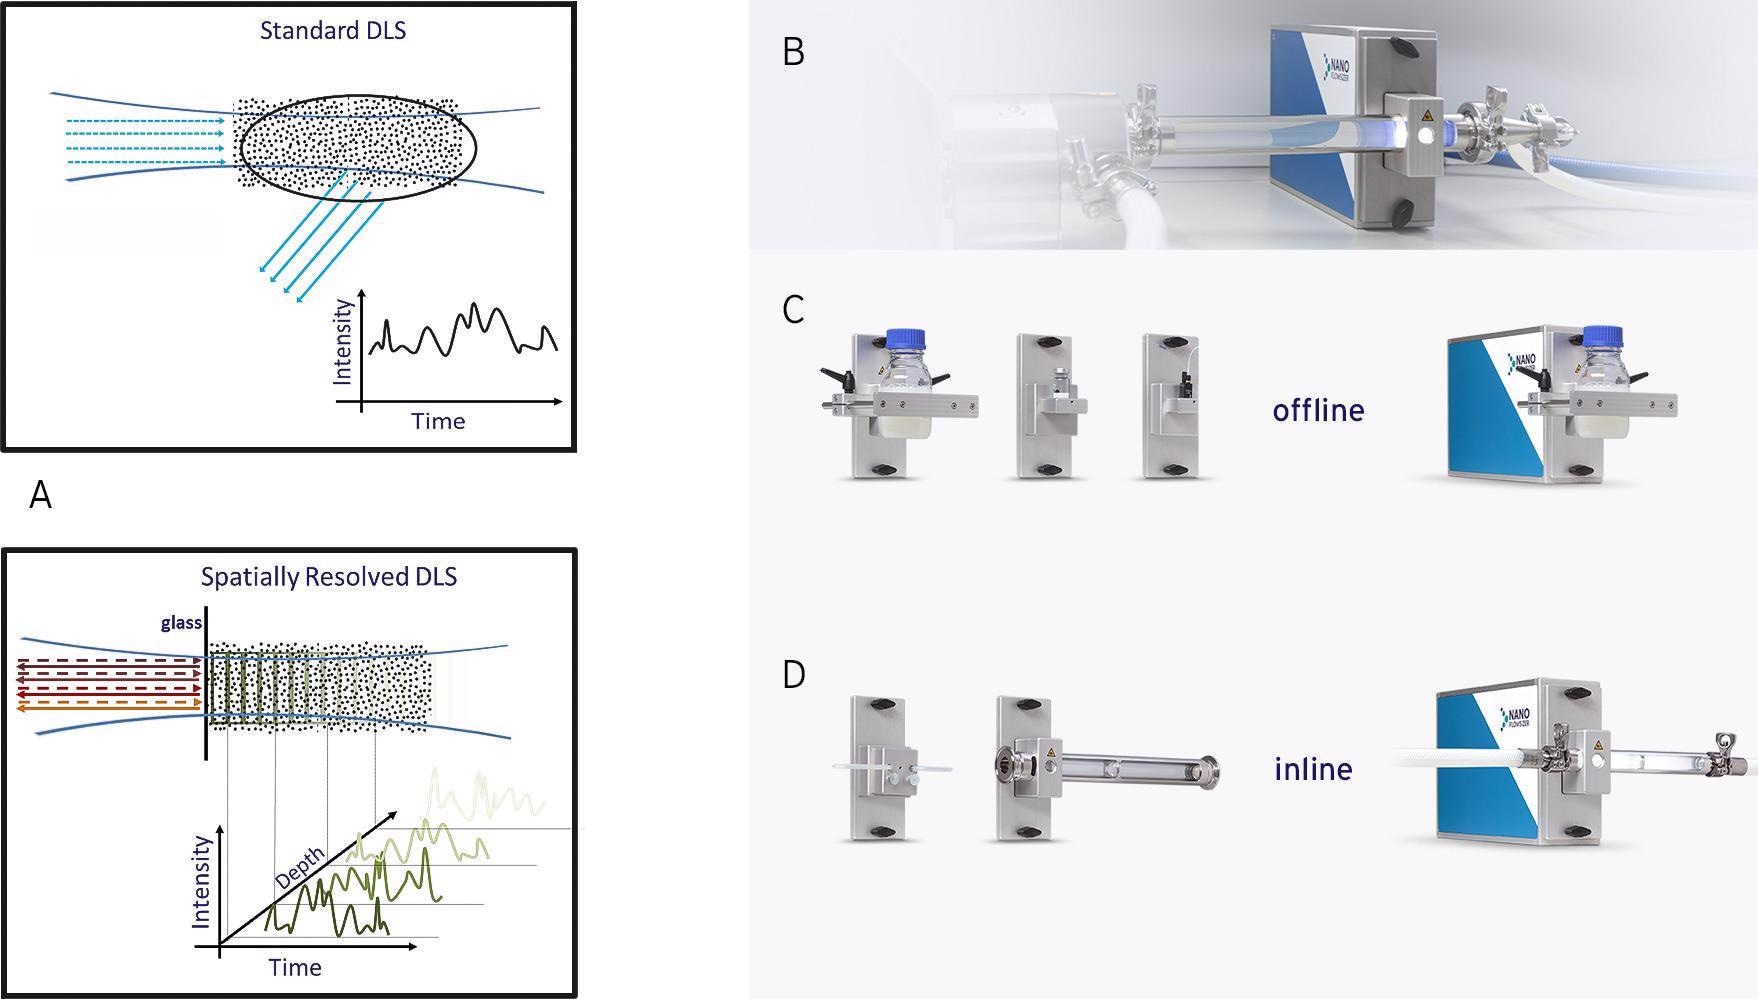
Figure 2A: Schematic comparison of regular DLS based measurements (top-left) and SR-DLS based measurements (bottom-left) as used in the Nanoflowsizer in which the light scattering is resolved versus depth in the suspension. 2B: The Nanoflowsizer probe unit, integrated into a process flow. 2C: top row shows cuvette, vial, and bottle modules; 2D: bottom row shows flow cell modules for inline measurements.
The Nanoflowsizer significantly improves on standard DLS by resolving backscattered light as function of the scattering depth (pathlength) in the sample, enabled via ‘low coherence interferometry’ with broadband NIR light (peak emission at ~1300 nm) [13]. This offers the capability to analyze and separate particle diffusion and flow effects in the intensity fluctuations resolved at each depth and simultaneously allows for automated depth selection of multiple and single scattered signals. Analyzing the latter down to short path lengths opens a large NP size and concentration range for SR-DLS, not accessible for standard DLS. Combining this with the high-speed nature (~2-10 seconds per measurement) and the capability to measure nanosuspensions in laminar flow makes the Nanoflowsizer an excellent PAT tool, fit for the future of the nanotechnology industry. Process monitoring can be achieved by integrating the Nanoflowsizer probe unit into a process (Fig.2B) using various dedicated flow cell adaptors (from µm-scale cells up to 2-inch pipes, Fig.2D) for direct inline measurement. Samples can also be analyzed in regular glass containers using various cuvette and vial modules (Fig.2C), allowing the use of this system in R&D laboratory settings as well.
Measurement of particle size distributions in turbid TiO2 nanosuspensions
To demonstrate the suitability of the Nanoflowsizer to monitor real-time NP growth during syntheses of turbid suspensions, a sol-gel synthesis of TiO2 NPs in a water/ethanol mixture was performed according to Widoniak et al [14]. In this Stober-type synthesis [15], Tetraethoxytitanium (TEOT) is added to an ethanol/water mixture containing KCl under a N2 atmosphere. In Fig.3A, a representative example of a synthesized highly turbid TiO2 nanosuspension is compared to a vial containing pure solvent.
Using the Nanoflowsizer’s unique pathlength-resolved measurement principle, the size of synthesized TiO2 NPs can be determined without dilution. In Fig.3B, the particle size distributions of three individual replicate synthesized TiO2 nanosuspensions similar to the one depicted in Fig.3A are shown (grey dashed lines). Notably, the mean final Zav particle size of the three individual replicate syntheses (solid blue line in Fig.3B) is very similar to the result reported earlier in [14], as indicated by the black solid line in Fig.3B. Specifically, we find an average size of 297 nm ± 6% upon protocol replication, very close to the reference value of 300 nm ± 5% [14]. This shows the excellent reproducibility of this synthesis method.
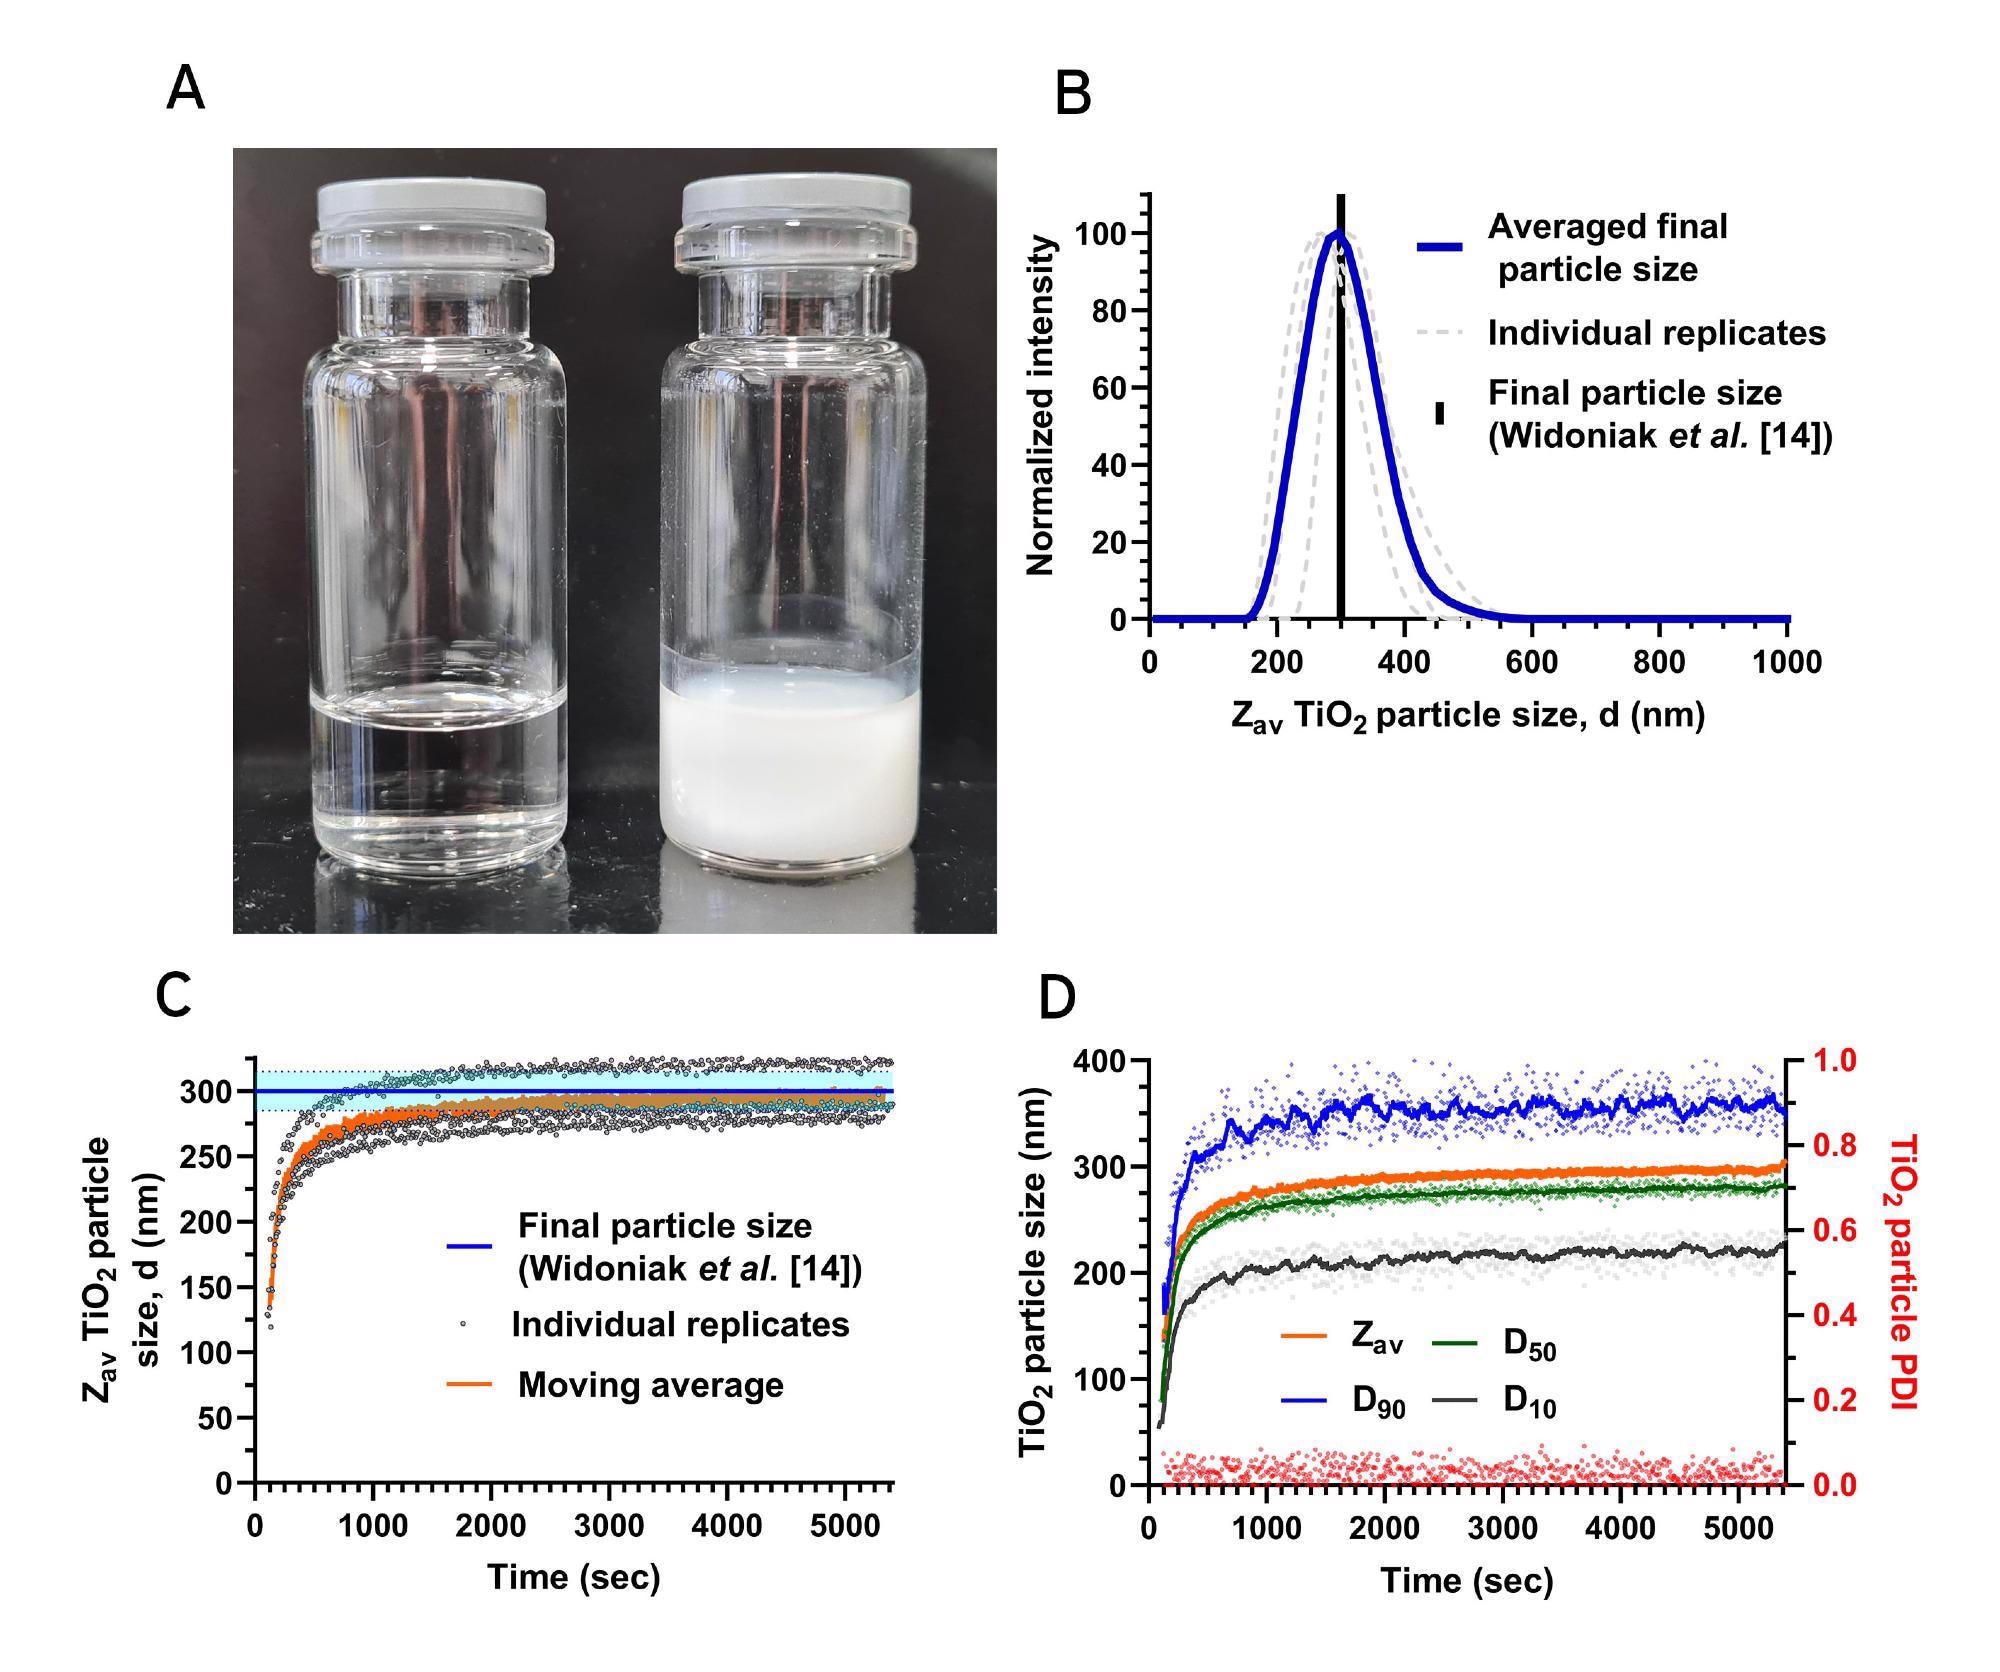
Figure 3A: Photograph of a clear ethanol solution (left) and a turbid TiO2 in ethanol nanosuspension (right) made as reported in 'Materials and methods'. 3B: Measured particle size distributions of a TiO2 nanosuspension made using a 1:100 KCl:TEOT molar ratio (n=3). 3C: Zav TiO2 NP size over time during synthesis, using a 1:100 KCl:TEOT molar ratio. The blue line and the light blue band indicate the previously reported final particle size [14] and relative standard deviation, respectively. 3D: Time evolution of the NP’s D10, D50, and D90 (left Y-axis), and the PDI (red, right Y-axis), during a 1:100 KCl:TEOT molar ratio synthesis. Solid lines show a moving average, dots indicate individual timepoints.
Due to the high measurement speed of the Nanoflowsizer, monitoring TiO2 particle size in undiluted reaction mixtures during synthesis is easy. In Fig.3C, the Zav over time of the three replicate TiO2 syntheses are shown (each grey dot indicates an individual measurement). For reference, the mean particle size over time (orange solid line in Fig.3C) and the TiO2 particle size under identical synthesis conditions and standard deviation per synthesis as found in [14] are also shown (blue solid line and light blue band in Fig.3C respectively).
Using the Nanoflowsizer’s dedicated analysis software, it is also possible to extract the particle size distribution from the measured autocorrelation functions, using regularized Laplace inversion. This gives additional information beyond the usual (cumulant) Zav and PDI results. From the obtained size distributions, important measurands for NP process control and analysis such as the D10, D50, and D90 particle size can also be determined over time (see Fig.3D).
Measuring particle formation kinetics with the Nanoflowsizer:
To further show the ability of the Nanoflowsizer to monitor NP size during formation and processing, additional TiO2 NP syntheses were performed under different conditions. Specifically, the amount of water and KCl in the water/ethanol solvent mixture was changed to vary the TiO2 particle nucleation and growth rates, changing the synthesized TiO2 particle size and PDI. In the performed sol-gel synthesis, hydrolysis of TEOT allows the formation of solid TiO2 NPs and ethanol according to:
Ti(OC2H5)4 (liquid) + 2∙H2O (liquid) → TiO2 (solid) + 4∙C2H5OH (liquid)
This process occurs in two steps [16,17]. Firstly, TiO2 nuclei are formed via hydrolysis and monomer reaction in a fast initial nucleation phase. These nuclei then grow via interparticle aggregation in a process termed condensation. In the second phase, further particle growth is facilitated mainly due to the addition of monomer to the existing TiO2 particles. The latter growth mechanism is typically slower in nature than the former. By reducing the amount of aqueous 0.1M KCl added to the reaction mixture prior to the introduction of the TEOT, it becomes possible to control the TiO2 particle nucleation rate.
In Fig.4A, particle size over time of TiO2 syntheses performed by reducing the amount of added aqueous KCl solution in the reaction mixture are shown. Specifically, the molar ratio of KCl:TEOT is lowered from 1:100 to 1:150 and 1:200. This reduced addition simultaneously alters the H2O molar excess over TEOT from ~5× to ~4× and ~3× respectively. The reduction of available H2O and KCl in the reaction mixture leads to a larger final TiO2 particle size, less initial nucleation, and slower growth over time. The observed changes in particle growth kinetics and particle size can be explained as follows: during the initial TiO2 growth stage, water reacts with TEOT, allowing (partially) hydrolyzed organoalkoxytitanates to condense and rapidly form nuclei. During the initial stage, TEOT hydrolysis is the rate-limiting step in nucleation, and the reduction in available H2O limits the rate of formation of initial nuclei, leading to a lower number of TiO2 NPs formed [16]. This limited initial nucleation is also reflected in the second, slow growth phase, where it can be observed that the 1:200 KCl:TEOT molar ratio synthesis leads to a long slow growth through monomer addition over time. This long second growth phase is due to the relatively large amount of monomer that is free in solution due to the limited nucleation. Additionally, due to the relatively low total surface area of the TiO2 NPs formed in this specific synthesis, the probability of monomer collision and subsequent addition onto the particles becomes lower as well, leading to slow growth.
The low number of particles formed in the initial stages of the 1:200 KCl:TEOT molar ratio synthesis can also be observed from the low backscattered intensity, Ib, as detected by the Nanoflowsizer during reaction monitoring (see Fig.4B). Due to this low initial particle count, monitoring the size only becomes feasible after ~800 seconds, in contrast to the 1:100 and 1:150 KCl:TEOT molar ratio syntheses, where sufficient scattering is quickly established.
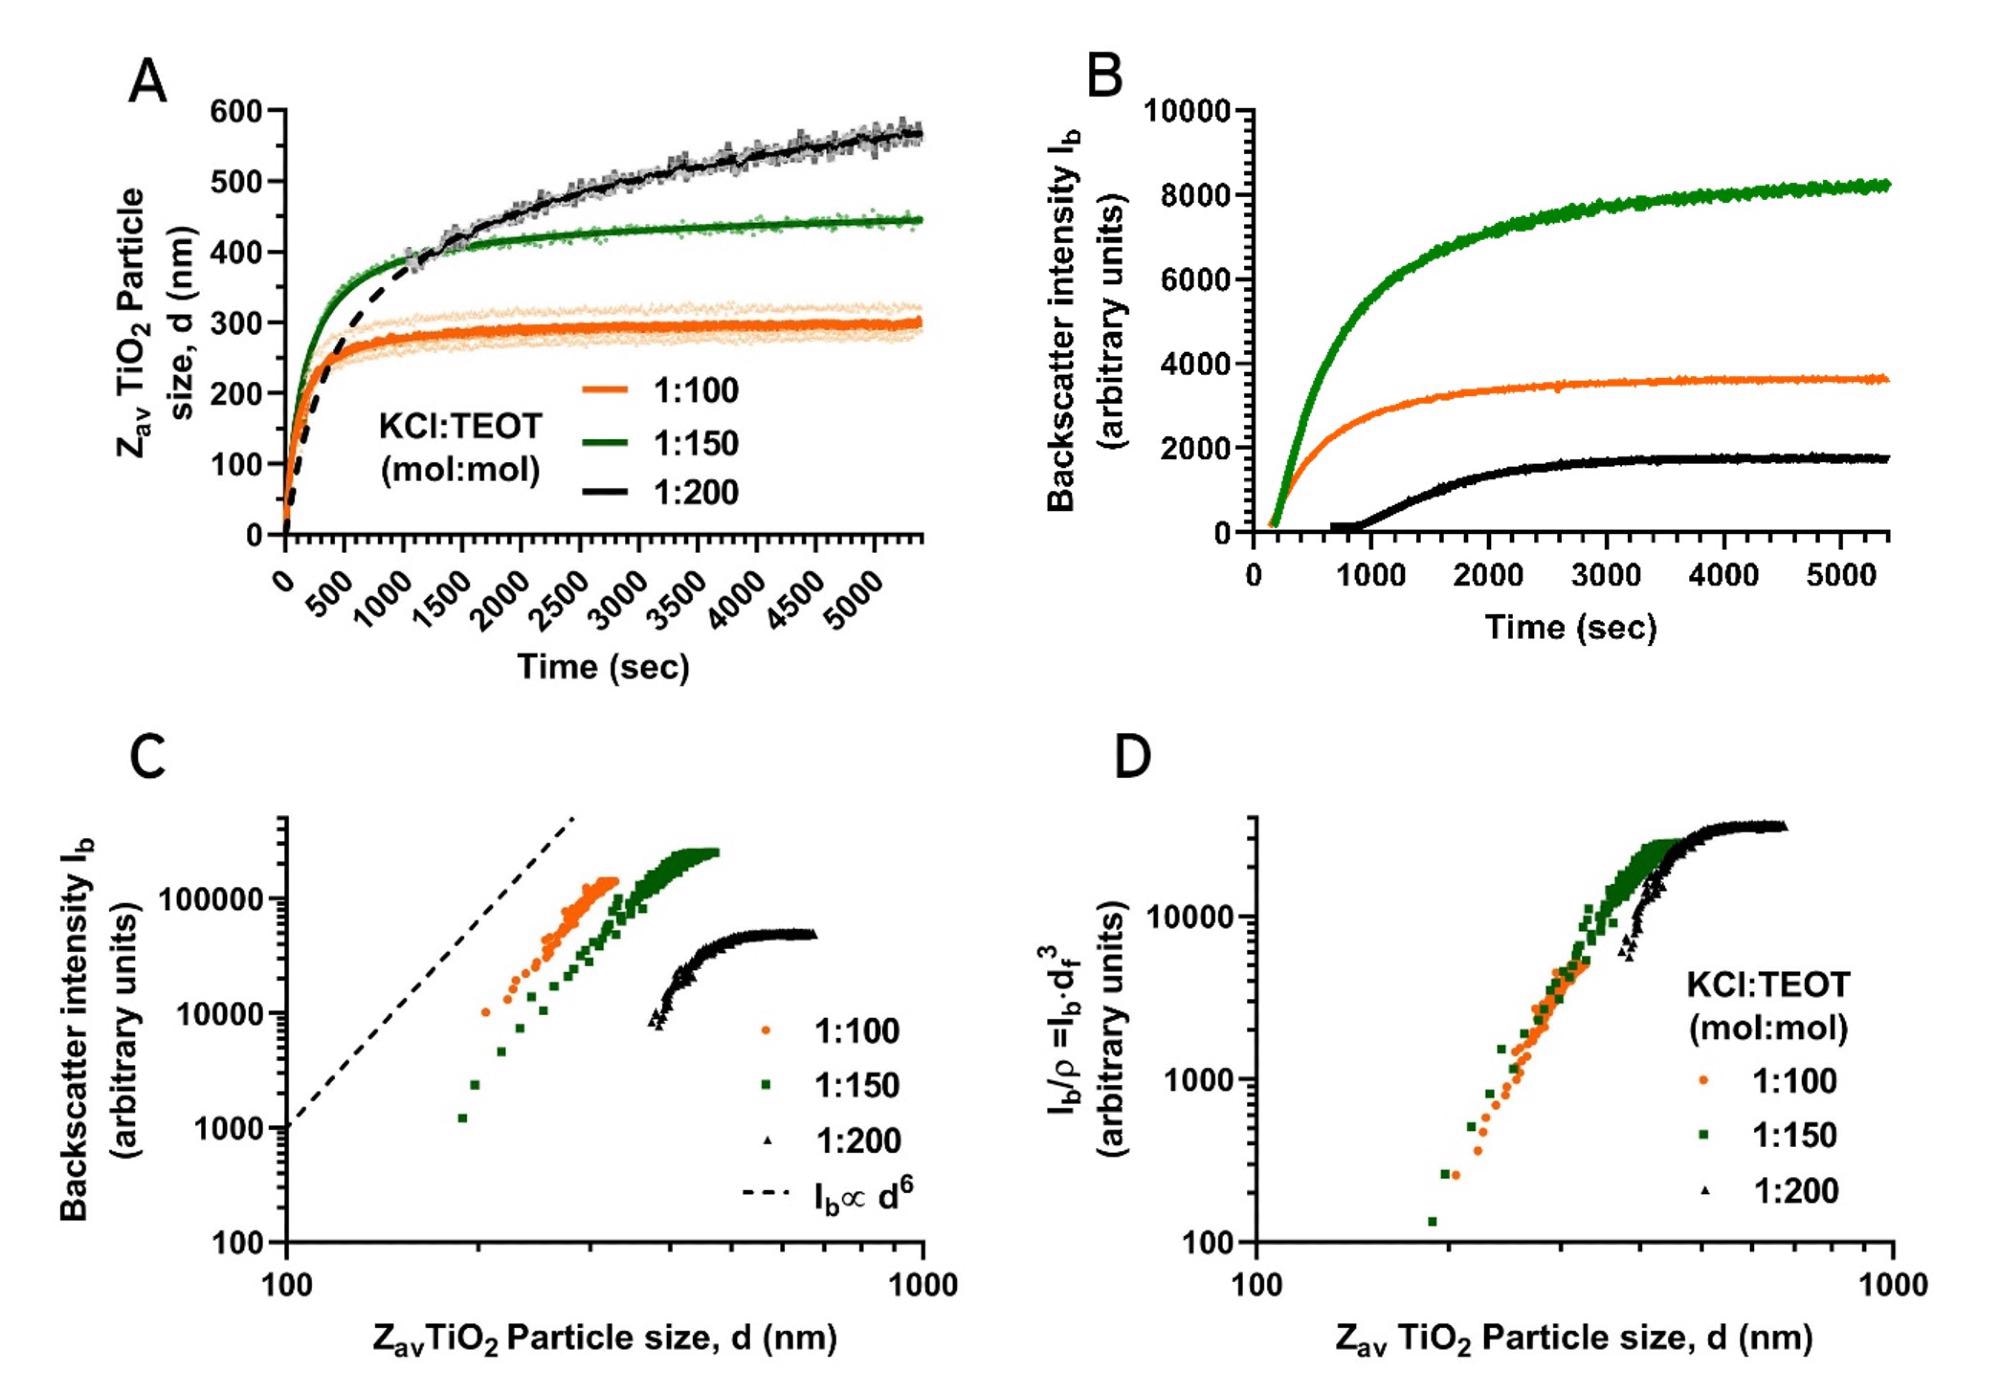
Figure 4. NP Size (4A) and scatter intensity (4B) characteristics of the TiO2 NPs monitored over time during syntheses using a 1:100, 1:150 and 1:200 KCl:TEOT molar ratio (orange, green and black data, respectively). For the data from the 1:200 KCl:TEOT synthesis, the dashed line shows an extrapolation to the origin. 4C: Particle size versus backscattered intensity for the three different KCL:TEOT molar ratios. 4D: Same data as in 4C, but with intensities scaled by the estimated number of particles per volume ρ to compare mean scattering per particle.
Additional insight in the growth and scattering properties is obtained from the relation between the scattered intensity, Ib, and the measured size, shown in Fig 4C. The 1:100 and 1:150 KCl:TEOT molar ratio syntheses show trends indicative of growth of a fixed number of particles with Rayleigh scattering characteristics, which gives an intensity increase Ib ∝ d6 (dashed line in Fig. 4C). In contrast, the 1:200 KCl:TEOT molar ratio reaction shows different behavior: the intensity rises faster than d6 for small sizes and levels at larger size. The latter trend is expected due to the transition to Mie Scattering for larger particles. Generally, the intensity is linked to the number of particles per volume, ρ , and the (size dependent) scattering per particle Q via Ib ∝ ρ x Q(d). Assuming that, for all reactions, the NPs attain the same final volume fraction ρf, and are monodisperse with a final size df , their final concentration is ρf ∝ 1/df 3. If this is not changing during growth, the scattering per particle is Q(d) ∝ Ib/ρf ∝ Ib x df3. Thus, this scaled intensity vs. size (shown in Fig 4D, using df from table 1) should collapse for different syntheses, assuming NPs of a given size are optically the same (i.e. same RI) for different syntheses. This indeed occurs for the 1:100 and the 1:150 syntheses. In contrast, the fast intensity rise for the 1:200 synthesis highlights the polydispersity for this reaction and also indicates that a growing number of NPs contributes to the scattering.
Determining synthesis failure conditions with the Nanoflowsizer:
Importantly, using the Nanoflowsizer to monitor NP synthesis, it becomes possible to determine polydisperse characteristics already during particle formation. This allows for quick rejection of batches with unacceptably high PDI or D90. This is for instance highlighted in Fig.5A, where the final particle size distributions of the syntheses performed with different KCl:TEOT ratios are shown. As discussed earlier, the main particle populations of these syntheses are larger when the amount of aqueous KCl added prior to reaction is smaller. For the 1:200 KCl:TEOT sample, a large fraction of particles of a high size (~2-5 µm in diameter) is seen to occur. This matches with the measured D90 and PDI data shown in table 1 and the observations in the previous paragraph.
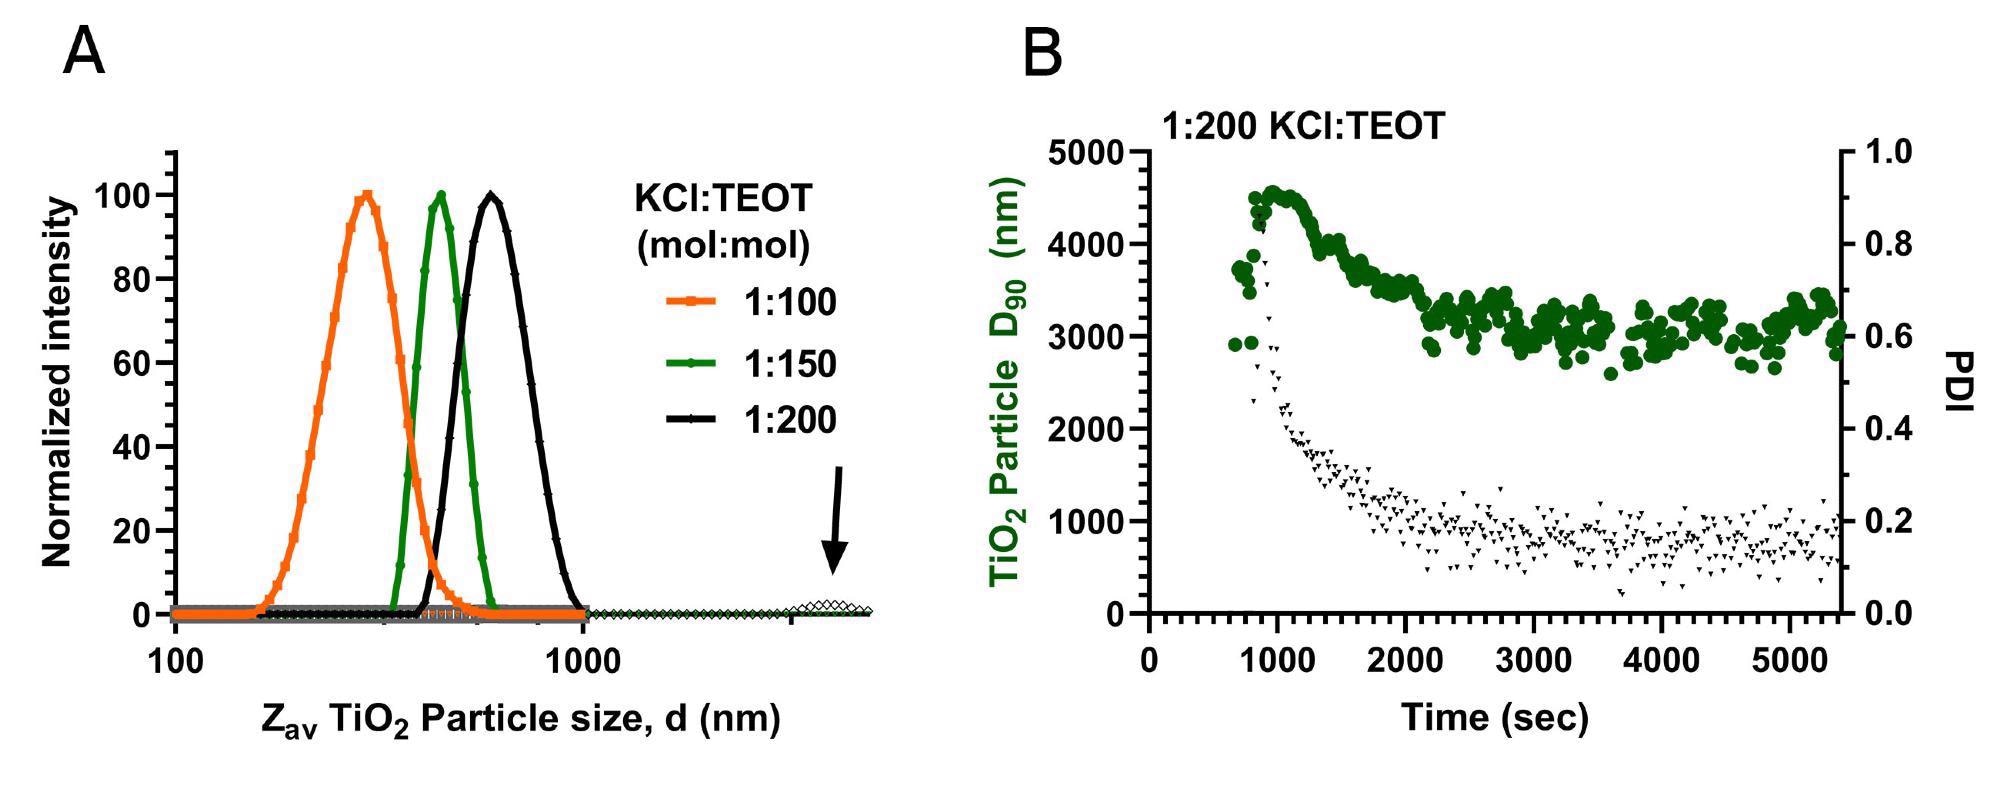
Figure 5A: PSDs of the TiO2 nanosuspension synthesized using a 1:100, 1:150 and 1:200 KCl:TEOT molar ratio (orange, green and black lines respectively) in the last stage of synthesis (t=5500, 5500 and 10500 sec for 1:100, 150 and 200 molar ratio respectively). 5B: The D90 (green circles) and PDI (black triangles) over time for NPs during the synthesis at the 1:200 KCl:TEOT molar ratio.
Table 1: Final characteristics of the synthesized TiO2 NPs (note that all distributions are intensity-based)
|
KCl:TEOT mol ratio
|
Zav1 (nm)
|
PDI1
|
PSD2 D10, D50, D90 (nm)
|
PSD mean size2 df (nm)
|
|
1:100
|
297
|
0.02
|
240, 292, 371
|
332
|
|
1:150
|
453
|
0.01
|
377, 439, 512
|
452
|
|
1:200
|
647
|
0.19
|
463, 601, 3603
|
956
|
1: calculated using cumulant fitting method, 2: calculated using regularized LaPlace inversion fitting method.
Using the D90 parameter as quality control, the Nanoflowsizer is excellently suited to detect fractions of highly aggregated (often undesired) large particles, and it can do so already during synthesis. In Fig.5B, the measured D90 and PDI overtime of the 1:200 KCl:TEOT synthesis are shown. The D90 and PDI are highest at the beginning of the synthesis, indicating that the nucleation phase for this synthesis yields a broad set of particle sizes, throughout the synthesis, both D90 and PDI drop, likely due to further aggregation and sedimentation of the largest particles. The use of the Nanoflowsizer in detecting such polydisperse synthesis outcomes, as monitored by D90 and PDI, is thus of high value to validate or reject batches of NPs in an industrial process.
Conclusions:
The use of SR-DLS and the Nanoflowsizer in the continuous monitoring of TiO2 NP syntheses in highly turbid suspensions has been demonstrated here. With the Nanoflowsizer, monitoring important quality attributes like the Zav, PDI and D90 is possible directly during synthesis, without any off-line sample preparation or dilution. Specifically, we show that assessing the quality of nanoparticle batches and processes is possible already during particle formation. Additionally, simultaneous assessment of the size and scatter intensity can further elucidate the synthesis characteristics. Incorporating the Nanoflowsizer into either R&D or industrial nanoparticle production offers significant benefits for process understanding and quality control. It also offers strong efficiency benefits, as the versatile SR-DLS based instrumentation can replace more extensive, laborious, and error-prone methods presently required for nanoparticle size characterization and quality control.
Materials and methods:
Suspension turbidity calculations:
The turbidity (scatter coefficients) underlying the regime maps in Fig. 1 were calculated using Mie-Theory for spherical particles with particle refractive index (RI) values shown in the figure title. In addition, the refractive index of water was used for the host medium and ‘dependent scattering’ (at higher concentration) was accounted for by incorporating the structure factor in the calculations [18]. The SR-DLS boundaries in Fig.1 were established by determining, at each concentration, the size for which the total scattering coefficient is ~50mm-1 (i.e. ~20 μm mean free path between scattering events). For the ‘standard’ DLS boundaries, a maximum turbidity (at a wavelength of 640 nm) of 2mm-1 (~ 500 μm smallest mean free path) was employed beyond which multiple scattering effects bias the data. The modified TiO2 refractive index at 640nm was accounted for by an approximate Sellmeier equation.
TiO2 particle synthesis:
In a 10 ml glass vial with a rubber stopper, containing 2 mL of N2 flushed Ethanol (Ethanol absolute, VWR, The Netherlands) 80, 60 or 40 µl of 0.1 M aqueous KCl was added. After the addition of 170 µl of Tetraethoxytitanium (TEOT, 98% pure, Sigma-Aldrich, The Netherlands), the mixture was vigorously stirred for 30 seconds, after which the vial was placed in the NFS vial module and monitoring started. Please consult table 2 for the specific reagent amounts per synthesis.
Table 2: TiO2 Particle synthesis specifics
|
TEOT added (µL)
|
0.1 M KCl added (µL)
|
KCl:TEOT molar ratio1
|
TEOT:H2O molar ratio1
|
|
170
|
80
|
~1:100
|
2:11
|
|
170
|
60
|
~1:150
|
1:41
|
|
170
|
40
|
~1:200
|
5:14
|
1: Calculated using a molecular weight of 74.56, 18.02 and 232.14 g/mol for KCl, H2O and TEOT respectively.
Nanoflowsizer measurements and SR-DLS size analysis:
TiO2 NP size characterization was performed with the Nanoflowsizer using the vial module (see Fig.2C, middle module) and controlled and visualized using InProcess-LSP’s XsperGo software. Depth scans (1024 pixels) from the vial-suspension interface up to ~3 mm maximum pathlength in the suspension were acquired at 48 kHz during 4 measurement blocks of ~1.3s each. The depth-resolved correlation functions (lagtime resolution ~ 21μs) and resulting mean correlation function in each block analyzed by XsperGo’s algorithms were averaged over the blocks for optimum statistics and outlier removal, giving a high-quality single scattering autocorrelation function within ~6s for each measurement. From the latter, the Zav and PDI were calculated using the Cumulant method integrated in XsperGo [19]. For the PSDs (Fig.3B and 4C), Xspergo uses regularized Laplace inversion [20], for which the regularization parameter was optimized to ∧ = 0.5, and a correlation function cut-off value of 0.05 was used. The viscosity and solvent RI employed were that of pure ethanol at ambient temperature.
References
(1) Mohajerani, A. et al, Nanoparticles in Construction Materials and Other Applications, and Implications of Nanoparticle Use. Materials 2019, Vol. 12, Page 3052 2019, 12 (19), 3052.
(2) Lucas, S. S. et al, Incorporation of Titanium Dioxide Nanoparticles in Mortars — Influence of Microstructure in the Hardened State Properties and Photocatalytic Activity. Cement and Concrete Research 2013, 43 (1), 112–120.
(3) Weir, A. et al, Titanium Dioxide Nanoparticles in Food and Personal Care Products. Environmental Science and Technology 2012, 46 (4), 2242–2250.
(4) Ziental, D. et al, Titanium Dioxide Nanoparticles: Prospects and Applications in Medicine. Nanomaterials 2020, Vol. 10, Page 387 2020, 10 (2), 387.
(5) Völz, H. G. et al, Pigments, Inorganic. in Ullmann’s Encyclopedia of Industrial Chemistry, 7th Edition | Wiley.
(6) Piccinno, F. et al, Industrial Production Quantities and Uses of Ten Engineered Nanomaterials in Europe and the World. Journal of Nanoparticle Research 2012 14:9 2012, 14 (9), 1–11.
(7) Robichaud, C. O. et al, Estimates of Upper Bounds and Trends in Nano-TiO2 Production As a Basis for Exposure Assessment. Environmental Science and Technology 2009, 43 (12), 4227–4233.
(8) Matthias, A. et al, Dependence of Refractive Index of Nanoparticle-Derived Titania Films on Glass. Thin Solid Films 2014, 558, 86–92.
(9) Möls, K. et al, Influence of Phase Composition on Optical Properties of TiO2: Dependence of Refractive Index and Band Gap on Formation of TiO2-II Phase in Thin Films. Optical Materials 2019, 96, 109335.
(10) K. A. Bakeev, Process Analytical Technology: Spectroscopic Tools and Implementation Strategies for the Chemical and Pharmaceutical Industries: Second Edition. John Wiley and Sons, 2010.
(11) Einstein, A. Zur Theorie Der Brownschen Bewegung. Annalen der Physik 1906, 324 (2), 371–381.
(12) Mahl, D. et al, Possibilities and Limitations of Different Analytical Methods for the Size Determination of a Bimodal Dispersion of Metallic Nanoparticles. Colloids and Surfaces A: Physicochemical and Engineering Aspects 2011, 377 (1–3), 386–392.
(13) Besseling, R. et al, New Unique PAT Method and Instrument for Real-Time Inline Size Characterization of Concentrated, Flowing Nanosuspensions. European Journal of Pharmaceutical Sciences 2019, 133, 205–213.
(14) Widoniak, J. et al, Synthesis and Characterisation of Porous and Non-Porous Monodisperse TiO2 and ZrO2 Particles. Colloids and Surfaces A: Physicochemical and Engineering Aspects 2005, 270–271 (1–3), 329–334.
(15) Ghimire, P. P.; Jaroniec, M. Renaissance of Stöber Method for Synthesis of Colloidal Particles: New Developments and Opportunities. Journal of Colloid and Interface Science. Academic Press February 15, 2021, pp 838–865.
(16) van Blaaderen, A.; Vrij, A. Synthesis and Characterization of Colloidal Model Particles Made from Organoalkoxysilanes. In Colloidal Silica: Fundamentals and Applications; 2005; pp 65–80.
(17) Han, Y. et al, Unraveling the Growth Mechanism of Silica Particles in the Stöber Method: In Situ Seeded Growth Model. Langmuir 2017, 33 (23), 5879–5890.
(18) Fraden, S.; Maret, G. Multiple Light Scattering from Concentrated, Interacting Suspensions. Physical Review Letters 1990, 65 (4), 512.
(19) Frisken, B. J. Revisiting the Method of Cumulants for the Analysis of Dynamic Light-Scattering Data. Applied optics 2001, 40 (24), 4087–4091.
(20) Provencher, S. W. Inverse Problems in Polymer Characterization: Direct Analysis of Polydispersity with Photon Correlation Spectroscopy. Macromolecule Chemistry 1979, 180, 201–209.
Note that particle interaction effects- which modify the particle diffusion rate- often become significant for any DLS method above 10 volume % and may require additional ‘calibration’ of the (Stokes-Einstein) diffusion-to-size conversion.
This article is written by Carl Schuurmans, InProcessLSP.