Sponsored by Nanosurf AGReviewed by Olivia FrostJan 23 2023
This article discusses AFM studies of self-assembled semi-fluorinated alkanes on Silicon, HOPG, and MoS2 substrates.
Covalently linked sequences of -CF2- and -CH2- groups with -CF3 and -CH3- terminals generate these compounds. Their chemical formula F(CF2)n(CH2)mH is abbreviated as FnHm (Figure 1a).
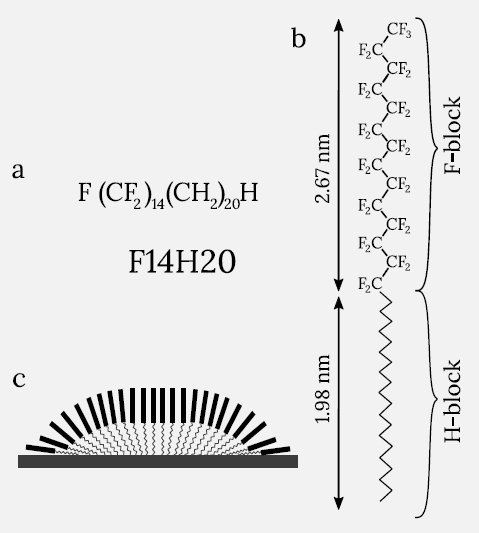
Figure 1. (a) Schematic representation of semi-fluorinated alkane molecule F14H20. (b) Its sketch and sizes in molecular aggregates. (c) A possible arrangement of F14H20 self-assemblies on flat substrate. The (CH2)20CH3 part is more flexible, than the rigid and more hydrophobic CF3(CF2)14 part. Image Credit: Nanosurf AG
The compounds are made up of two incompatible subunits that segregate into distinct domains in the same way that block copolymers do, but without polydispersity in molecular weight.
Structural ordering of such compounds is controlled by the strong incompatibility of the constituting segments and by the fact that the van der Waals cross-section of the flexible hydrocarbon segment is 25- 30% smaller than that of the rigid helical perfluorinated segment (Figure 1b).
According to X-Ray reflectivity measurements of F14H20 films, the fluorinated chains are orientated normally to the surface layer and the alkyl segments are tilted with an angle between the two segments. This validates the preliminary model of F14H20 self-assembly, as shown in Figure 1c.
Experimental Details
The conflict between the ordering of the hydrocarbon blocks and fluorocarbon blocks results in a unique but not fully understood polymorphism of their self-assemblies, which is dependent on solvent, substrate, deposition, and temperature.
In addition to F14H20 alkanes, F12H12 and F12H20 compounds were also used. The samples were produced by spin-casting their solutions in perfluorodecalin onto Si, HOPG, and MoS2.
Due to the antagonistic nature of the two building components and the mismatch in the cross-section between the perfluoro and the perhydro-alkyl tail, their adsorbates on flat substrates create separate superstructures.
AFM is the key method for observing the self-assemblies of the semi-fluorinated alkanes, as shown in the images below. All AFM measurements were conducted at room temperature, and the DriveAFM microscope was utilized in dynamic mode with photo-thermal excitation of the probe (CleanDrive).
In these experiments, commercially available soft dynamic mode cantilevers with spring constants in the range of 1- 10 N/m were applied.
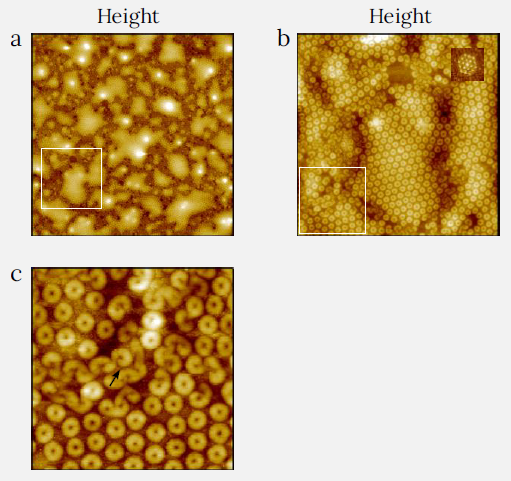
Figure 2. Height images of F14H20 layers on Si substrate, showing multiple arrays of molecular self-assemblies in the shape of nanoscale toroids. The white square in (a) indicates the location of the enlarged pattern in (c) and the white square in (b) indicates the location of the (c). Arrow in (c) indicates ribbons, where the toroids have failed to form. (a) Image size: 5 x 5 μm2, height range: 20 nm. (b) Image size: 1.5 x 1.5 μm2, height range: 14 nm. (c) Image size: 0.5 x 0.5 μm2, height range: 9 nm. Image Credit: Nanosurf AG
AFM Measurements of F14H20
Figure 2a-2c depicts various arrays of molecular self-assemblies in the morphology of nanoscale toroids in the height images of F14H20 on Si.
In the elevated areas, the toroids are arranged in hexagonal order as documented by the Fourier transform pattern of the image, which is shown in the top right insert in Figure 2b.
In the valleys, short, curved ribbons, which are probable precursors of the toroids that developed during solvent evaporation, can be observed.
Figure 2c represents one of these locations. In Figure 3a-c, the F14H20 toroids are displayed at higher magnification. The height profile over four toroids reveals that these structures have an approximate diameter of 40 nm and a height of 2.5 nm. The height is less than the molecule’s length, which is 4.6 nm.
This difference can be explained by the tilt of the molecules and the sample depression caused by the AFM probe. The profile also indicates that the core cavities have a diameter of 10 nm, and the probe almost touches the substrate within the cavities. The toroids lack fine structures and appear smooth.
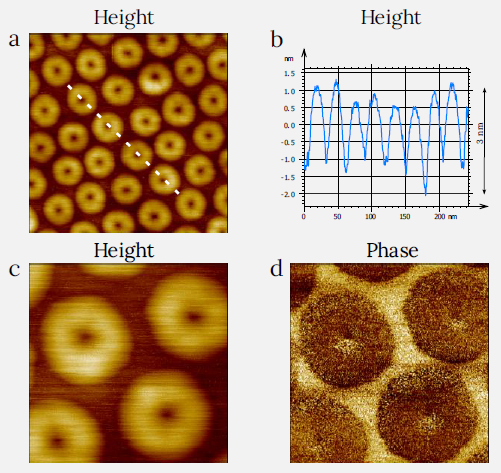
Figure 3. Height (a,c) and phase (d) images of F14H20 layers on Si. The height profile (b) was taken along the white dashed line in (a). (a) Image size: 0.3 x 0.3 μm2, height range: 5 nm. (c,d) Image size: 0.1 x 0.1 μm2, height range: 4.2 nm, phase range 9°. Image Credit: Nanosurf AG
Depending on the adsorbate thickness, the F14H20 molecules adsorbing to HOPG adopt distinct morphologies. Figure 4a depicts some ultrathin layers with a thickness similar to the molecular length.
Geometrical limitations imposed by the interfaces in conjunction with the conflicting ordering of the building blocks led to arrays of three-fold symmetrical straight ribbons. The ribbon array extends over two HOPG terraces. The ribbon width ranges from 50 to 70 nm, and its height is around 2.5 nm.
As seen in Figure 4b, flat ribbons coexist with arrays of toroids and patches of disordered material when the F14H20 adsorbate density is greater. A few large toroids with a diameter of 60 nm are seen in the top center of the image.
Figure 4b-c demonstrates that the collection of toroids in the image’s center is contained between sets of ribbons with varying orientations.
The diameters of these toroids are comparable to those found on Si substrate. However, they display diverse deformations as a result of being compressed by their environment (Figure 4d).
The phase image in Figure 4e also demonstrates the appearance of sectors in the individual species.
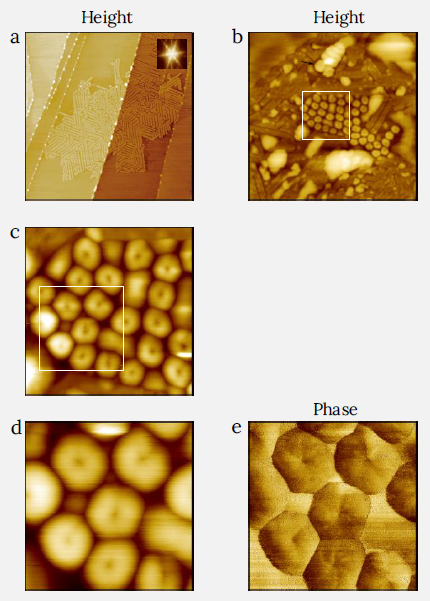
Figure 4. Height (a,b,c,d) and phase (e) images of F14H20 layers on HOPG showing their self-assemblies in ultrathin layer (a) and in thicker adsorbate in (b-e). White square in (b) indicates the location of zoomed-in area in (c), and white square in (c) indicates the zoomed-in area in (d,e). The black arrow in (b) indicates larger toroids. (a) Image size: 4 x 4 μm2, height range: 6 nm. (b) Image size: 1 x 1 μm2, height range: 25 nm. (c) Image size: 0.3 x 0.3 μm2, height range: 8 nm. (d,e) Image size: 0.15 x 0.15 μm2, height range: 10 nm, phase range 8°. Image Credit: Nanosurf AG
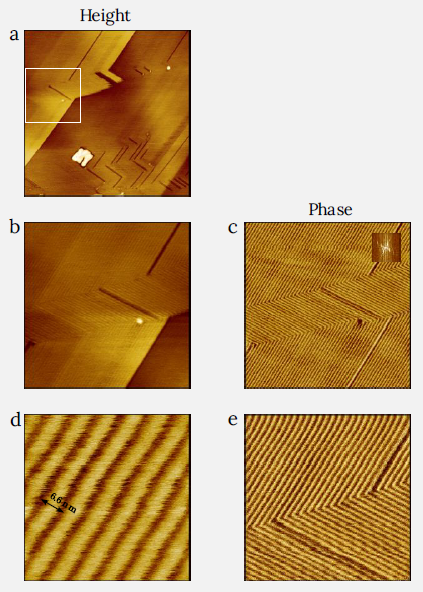
Figure 5. Height and phase images of F12H12 layer on HOPG. The angles between sets of differently oriented lamellae are close to 90 degrees as evidenced by Fourier transform pattern in the insert in top right corner of (c). The white rectangle in (a) shows the location of the zoomed in area in (b,c) (a) Image size: 1 x 1 μm2, height range: 2 nm.(b,c) Image size: 0.4 x 0.4 μm2, height range: 1.5 nm, phase range 2°. (d) Image size: 50 x 50 nm2, height range: 0.25 nm. Image Credit: Nanosurf AG
AFM Measurements of F12H12
AFM imaging of F12H12 self-assembly was performed on the HOPG substrate. Figure 5a depicts terraces with a small number of imperfect lamellar layers. The latter is shown as dark strips with orthogonal orientations and a rectangular inclusion domain.
With various orientations in height and phase images of 400 nm on the side, the linear features of the lamellar layers were resolved (Figures 5b-c).
In the height image, the darker stripes with a depth of 0.4 nm and a width of 1.3 nm indicate vacancies in the lamellar layer. The missing sheets are single molecular blocks based on depth.
The Fourier transform pattern (Figure 5c) verifies the orthogonal aliment of adjacent lamellar domains. Consequently, the intermolecular interactions of F12H12 molecules have directed this orientation and reduced substrate impact.
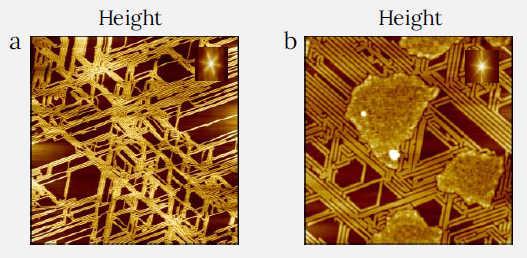
Figure 6. Height images of F12H20 self-assemblies on MoS2. Fourier transform patterns, which are shown in the inserts in (a) and (b) point out the trigonal symmetry of the self- assemblies’ arrangements. (a) Image size: 5 x 5 μm2, height range: 2.6 nm. (b) Image size: 2 x 2 μm2, height range: 3.5 nm, phase range 2°. Image Credit: Nanosurf AG
A small detail seen on one sheet and the boundary between differently oriented lamellar sheets are shown in height and phase images in Figures 5d-5e, respectively.
Individual lamellae have a width of 6.6 nm, according to the measurements of the spacings in the lamellar layers.
As the length of the F12H12 molecule is only around 3.5 nm, this supports a bimolecular arrangement of the alkane chains in the lamellae. The ribbons continue across the boundary; however, they are rotated by 90 degrees.
AFM Measurement of F12H20
The F12H20 adsorbate on MoS2 consists of several straight ribbons. In contrast, the F12H12 on HOPG, these ribbons are organized in trigonal order, as seen in Figures 6a-b. This is demonstrated by Fourier transform patterns inserted in the images in the upper line corner.
Figure 6b depicts four adsorbate patches, indicating that not all adsorbate transformed into ribbons.
Even though lattices of surface carbon atoms in HOPG and sulfur atoms in MoS2 are distinct, semi-fluorinated alkanes have the same symmetry on these substrates. Consequently, the primary cause for lamellar orientational order on this substrate is a match between the periodicities of -CH2- groups in typical alkanes and HOPG lattice.
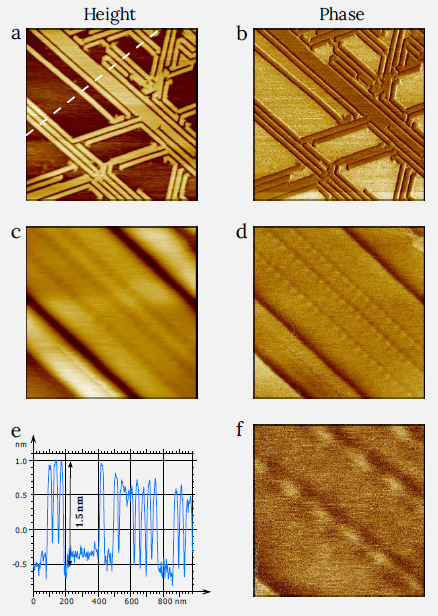
Figure 7. Height and phase images of F12H20 self-assemblies on MoS2.The height profile along the direction shown with white dashed line in (a) is presented between images (c) and (d) (a,b) Image size: 1 x 1 μm2, height range: 2.5 nm, phase range 20°. (b,c) Image size: 0.15 x 0.15 μm2, height range: 2 nm, phase range 6°. (f) Image size: 50 x 50 nm2, phase range 5°. Image Credit: Nanosurf AG
In images with greater magnification, the dimensions of the ribbons were measured (Figures 7a-7e). The height profile images in Figure 7e reveal that the ribbons have a height of 1.5 nm and a width that fluctuates between 30 and 40 nm. Occasionally, thinner ribbons are observed.
Figure 7c-d depicts one of these regions, where four ribbons interconnect with one another. Short bridges of 6 nm in length connect adjacent ribbons with a periodicity of around 9 nm. Figure 7f depicts only the fine features visible at a sub-40 nm scale.
Conclusion
This article demonstrates the visualization capabilities of AFM in dynamic mode for semi-fluorinated alkanes.
In adsorbates of semi-fluorinated alkanes, several nanoscale structures were observed. In these materials, the dissimilarities in the nature and geometry of the two building components result in the production of toroids, ribbons, and their intermediates.
Further efforts are required to visualize molecular arrangement in these structures using sub-100 nm scale imaging and off-resonance tapping (WaveMode). Scanning tunneling microscopy, which can be used for molecular scale visualization of ultrathin layers of these examined compounds on atomically flat conducting substrates, might be applicable in this regard.
Acknowledgments
Sergei Magonov, SPM LABS LLC, USA, prepared the measurements and the text of this article.

This information has been sourced, reviewed and adapted from materials provided by Nanosurf AG.
For more information on this source, please visit Nanosurf AG.