Sponsored by Nanosurf AGReviewed by Olivia FrostJan 24 2023
Polyethylene (PE) is a semicrystalline polymer that is one of the most extensively manufactured polymers in the world for consumer products and packaging. Shopping bags, milk bottles, storage containers, toys, wires, and cables all utilize polyethylene.
Polyethylene is also an important part of car fuel tanks and storage tanks. Polyethylene’s appeal stems from a combination of its aesthetic look, mechanical capabilities such as toughness and rigidity, ease of processing into different forms such as films, and cheap production cost.
Polyethylene is characterized according to its density and branching, with different types of PE having varying mechanical qualities and processability. High-density polyethylene (HDPE) is a linear structure of ethylene shown in Figure 1a, which results in a substantially greater degree of crystallinity.
Linear low-density polyethylene (LLDPE) exhibits substantial branching off its main chain, as seen in the schematic in Figure 1b, and is comparable in strength to HDPE but is significantly more flexible.
Low-density polyethylene (LDPE) exhibits considerable branching off its main chain, as shown in Figure 1c, resulting in decreased crystallinity and increased flexibility.
The mechanical characteristics of these distinct PEs vary considerably; for example, the modulus of LDPE ranges from 102-240 MPa, while the elastic modulus of linearly and organized HDPE ranges from 960-1000 MPa.
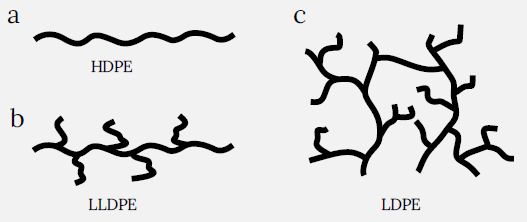
Figure 1. Types of polyethylene: (a) high density polyethylene (HDPE) linear, no branching of molecular chains; (b) linear low density polyethylene (LLDPE), short branched chains; (c) low density polyethylene (LDPE) long branched chains. Image Credit: Nanosurf AG
PE Polymer crystallization happens through a complicated method that involves both partial aligning of their molecular chains into ordered structures and amorphous areas with less ordered structures.
The organized structures are formed via chain folding and create areas known as lamellae. Chain folding occurs more readily in linear chains (such as HDPE) and is more difficult in branched chains (such as LDPE).
In dilute mixtures of linear PE chains, the multiple chain folding results in the development of crystalline lamellae with the lamellar thickness limited by the straight section of the chain.
When crystallization occurs in the melt or saturated polymer solution, different lamellar structures may arise. They can be converted from 2D platelets to 1D fibrils and even nanoscale grains.
Characterization of Polymers
Polymers exhibit nanoscale morphology, which necessitates the use of high-resolution techniques to adequately detect their structures. On the other hand, high-resolution microscopy approaches such as scanning electron microscopy (SEM) or transmission electron microscopy (TEM) depend on electron impingement with the material to generate contrast.
As AFM is dependent on a mechanical interaction between the tip and sample, it is ideal for imaging and characterizing polymers because they display a wide range of mechanical characteristics, such as adhesion and modulus, which subsequently serve as a foundation for contrast and differentiation in the AFM picture.
The DriveAFM was utilized to describe several grades and mixes of this ubiquitous and essential polymer. All images were gathered utilizing the CleanDrive approach to provide greater performance and data quality.
CleanDrive photothermally actuates the cantilever, providing cleaner and more reliable cantilever tunes over conventional piezo actuation. The cantilevers used in this research were commonly available soft dynamic mode cantilevers with nominal stiffness ranging from 1 to 7 N/m.
HDPE
The top of an HDPE specimen is shown in the height photos in Figures 2a and 2c; the HDPE surface was created by melting the polymer between two glass slides and then cooling it.
These patterns that are observed in the AFM images shown in Figure 2 are defined by several chains of lamellar blocks (width of ca. 25 nm), with some of them forming densely packed ribbons, as can be seen in the 1.2 μm image in Figure 2a.
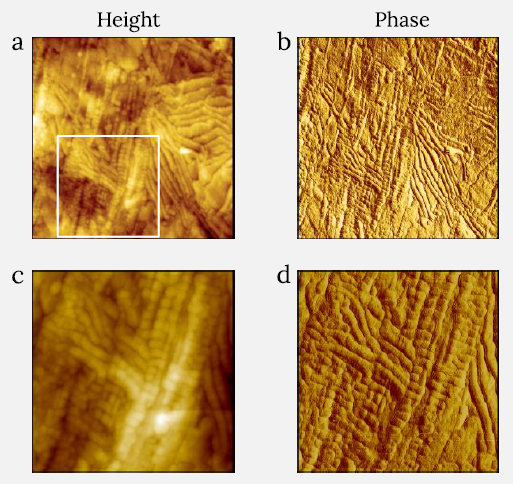
Figure 2. Height (a) and phase (b) images of melt-crystallized HDPE sample measured with CleanDrive technique. Image size: 1.2 x 1.2 μm2, height range: 34 nm, phase range 18°. White square in (a) shows the area where images (c) and (d) were recorded. Image size for (c) and (d) is 0.6 x 0.6 μm2, height range: 42 nm, phase range 10°. Image Credit: Nanosurf AG
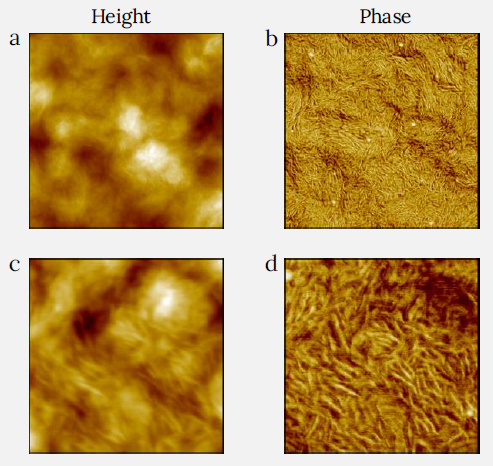
Figure 3. Height (a) and phase (b) images of LDPE film measured with CleanDrive technique. The sample was prepared by spin-cast of its toluene solution on Si substrate. Image size: 2 x 2 μm2, height range: 75 nm, phase range 55°. (c) and (d) images were recorded on the same sample with the image size 0.6 x 0.6 μm2, height range: 33 nm, phase range 25°. Image Credit: Nanosurf AG
LDPE
The surface morphology of LDPE shows a varied structure, as seen in Figures 3a and 3c. This film was created by spin-casting a hot solution of PE saturated in toluene onto a silicon substrate.
The surface of LDPE is composed of numerous fibrils with varying alignments, which are readily observed in the phase images (Figures 3b and 3d).
At greater magnification (Figure 3c and 3d), one can differentiate thicker fibrils with a width of ca. 15 nm and thin fibrils with a width of less than 10 nm. They are not as densely packed as lamellar blocks of HDPE.
LLDPE
LLDPE strands have less branching than LDPE, yet their density and elastic modulus are almost the same. The structure of an LDPE film is demonstrated in Figures 4a-d; this film was made similarly to LDPE by spin-casting a hot toluene solution in which the PE was dispersed onto a silicon substrate.
Unlike the LDPE film, the surface fibrils of LLDPE alternate with broader structures, which are visible as elevated features in the height image (Figure 4a).
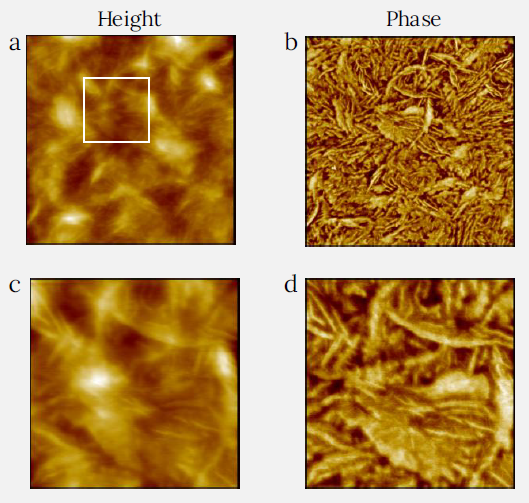
Figure 4. Height and phase images of LLDPE film measured using CleanDrive technique. The sample was prepared by spin-cast of its toluene solution on Si substrate. Image size: 2 x 2 μm2, height range: 76 nm, phase range 65°. White square in (a) shows the area where images (c) and (d) were recorded. Image size for (c) and (d) is 0.6 x 0.6 μm2, height range: 32 nm, phase range 57°. Image Credit: Nanosurf AG
Heterogenous Polymer Blends
In addition to high-resolution visualization of surface structures, which was demonstrated with images of lamellar order in HDPE, LDPE and LLDPE samples, AFM provides compositional imaging of heterogeneous polymer systems (blends, block copolymers, composites, filled rubbers), an important capability for industrial researchers working on the synthesis, design, and formulation of plastic materials as well as their applications.
A film made of a blend of LDPE and atactic polystyrene (PS) is investigated using AFM to determine the shape and distribution of the two ingredients in the mix.
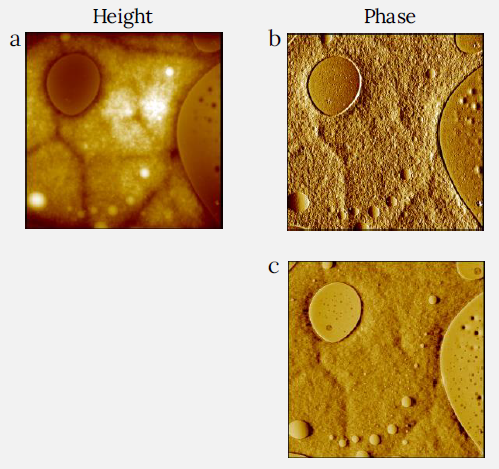
Figure 5. Height (a) and phase (b,c) images of PS and LDPE blend film measured with CleanDrive technique. The sample was prepared by spincast of its toluene solution on Si substrate. Two phase images were measured with different tip forces by varying the setpoint amplitude of cantilever oscillation. Lower setpoint corresponds to higher force (b: 65%, c: 50%). Higher force image shows higher phase contrast. Image size: 10 x 10 μm2, height range: 120 nm, phase range 25° (b) and 90° (c). Image Credit: Nanosurf AG
A succession of height and phase photographs of this PS/LDPE mix is illustrated in Figures 5a-c and Figures 6a-f. The elastic modulus of PS is around ca. 3 Gpa, which is roughly 10 times more than that of LDPE.
The height image of the PS/LDPE mix (Figure 5a) displays a reasonably flat surface with many round-shaped regions buried into a surrounding matrix. The difference in phase contrast between the two materials is observed when the setpoint amplitude is half of the probe-free oscillation, as shown in Figure 5c.
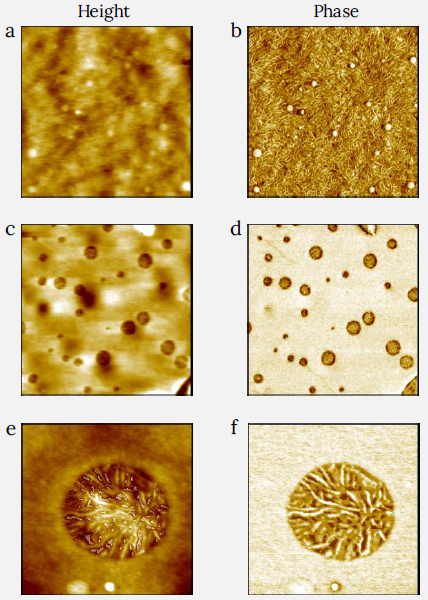
Figure 6. Images of PS and LDPE blend film measured with CleanDrive. The sample was prepared by spin-cast of its toluene solution on Si substrate. (a) and (b) show the height and the phase image of the LDPE matrix (zoom between the round domains in Figure 5) with fibrils clearly visible in the phase image. Image size: 2 x 2 μm2, height range: 30 nm, phase range 55°. (c) and (d) show the height and the phase of higher resolution images of the surface of one of the round PS domains from Figure 5. The flat area in the phase image shows microscopic dark inlusions of LDPE material with additional contrast. Image size: 2 x 2 μm2, height range: 10 nm, phase range 50°. (e) and (f) show the height and the phase images of a zoom on one of the inclusions from (c) and (d), showing that the increased contrast orginates from a clearly resolved fibrillar structure. Image size: 0.6 x 0.6 μm2, height range: 6 nm, phase range 110°. Image Credit: Nanosurf AG
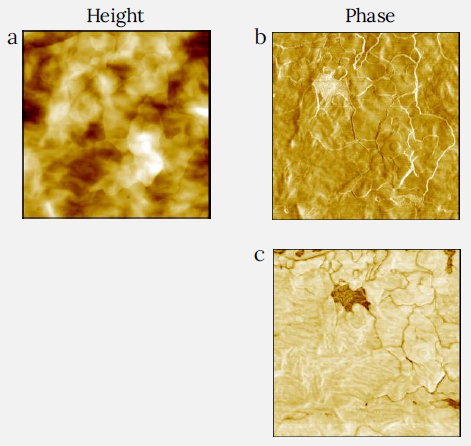
Figure 7. Height (a) and phase (b) and (c) images of LDPE packaging film measured with CleanDrive. The phase images were recorded at low and raised tip-sample forces by varying the setpoint amplitude of cantilever oscillation. Lower setpoint corresponds to higher force. A higher force image (c) demonstrates a missing platelet in the film coating – area with darker contrast. Usual LDPE fibrils are visible in this patch. Image size: 2 x 2 μm2, height range: 50 nm, phase range 17° for (b) and 112° for (c). Image Credit: Nanosurf AG
Better quality 2 x 2 μm2 images were then collected on the blend’s matrix (Figures 6a-b) and the round area (Figures 6c-f). The matrix material (6a-b) suggests a fibrillar structure typical of the lamellar morphology of LDPE.
This LDPE matrix also contains luminous round domains with diameters varying from 20 nm to 110 nm, which show specific PS droplets.
The zoom-in on the big circular regions from Figure 5 is demonstrated in the images of Figures 6c-f and shows a uniform morphology with bright yellow contrast, interrupted by tiny dark round micro-structured domains ranging in diameter from 20 nm to 210 nm.
A zoomed-in 0.6 x 0.6 μm2 photograph of one of these dark spots is exhibited in Figures 6e-f and reveals a thin, fibrillate-like lamellar structure of LDPE. The thicknesses of the fibrils are lesser than those seen in the LDPE matrix (Figure 6a-b).
LDPE Packaging
PE is widely used as packaging material, and LDPE is especially popular for packaging bread, frozen food, and shopping bags. These packaging materials are typically marked on the bags with the recycling label accompanied by “#4” for LDPE.
An LDPE industrial bag was assessed with the DriveAFM. The height and phase pictures obtained at low and high tip-sample pressures are depicted in Figure 7a-c.
The low-force imaging indicated that the top surface is richer in the platelet formations with well-defined curves and edges in the phase picture (Figure 7b). In this image, there is a brighter region that suggests a different substance.
Indeed, the phase picture with greater forces (Figure 7c) displays substantially darker contrast and individual brighter fibrils. The majority of the surface of this packaging film is covered with clay platelets which modify surface adhesion and prevent the packaging film from clinging to the bags.
Conclusion
AFM is an effective method for high-quality imaging and evaluation of polymer materials, where mechanical contrast is essential for distinguishing important structures and morphology.
In this case, AFM is used to characterize different grades of polyethylene in addition to PE-containing blends, one of the most common polymers in the consumer market. A lamellar framework of the polyethylene is readily visible in the various images, offering insight into the overall packing and structuring of PE.
This article demonstrates the capability and value of AFM in evaluating the structure-property connections of critical materials such as polyethylene, which may be utilized to increase the knowledge and formulation of such materials into final products.
Acknowledgments
Sergei Magonov, SPM LABS LLC, USA, prepared the measurements and the text of this article.

This information has been sourced, reviewed and adapted from materials provided by Nanosurf AG.
For more information on this source, please visit Nanosurf AG.