Lithium-ion batteries are a form of rechargeable energy storage with high energy density.
They have become vital to portable electronic devices, including cell phones, computers, construction power tools, medical equipment, and transportation applications such as electric vehicles.
This makes lithium-ion batteries essential for present societal demands.
As the demand for this type of energy storage grows, the demand for enhanced performance and lifetime also grows, as well as for decreasing the overall cost.
To overcome these challenges and enhance battery performance, further assessment of the microstructure of lithium-ion batteries is required.
Postmortem analysis provides valuable insight, contributing to further improvements in research and manufacturing.
In this context, the module ZEISS ZEN Intellesis for the image analysis software ZEISS ZEN core sets new standards in quantitative microstructure analysis.
ZEN Intellesis, part of the AI Toolkit of ZEN core, provides a simple-to-use machine learning-based segmentation that facilitates a battery's highly accurate yet straightforward phase content determination.
The phase contents – here, considered to be pores, particles, and current collector – influence the performance of a battery on the microstructure level, as shown in Figure 1.
This article compares three different evaluation methods to quantitatively assess the particle content of cathodes from current state-of-the-art lithium-ion batteries.
The most common format of lithium-ion batteries on the market is the 18650 batteries, and as a result, this type is used as test samples in this study.
Experimental Methods
The two digital evaluation methods of classical threshold value segmentation and segmentation using ZEN Intellesis are compared.
Since the manufacturer provided no compositional information about the porosity and particle content of the batteries, gravimetric analysis is utilized as a reference and third evaluation method.
In this latter analysis, the batteries are disassembled to the electrode level and are measured using a laboratory balance. Subsequently, the phase contents are established concerning the specific bulk densities of the materials present.
The manufacture of electrodes of power cells aims to provide high current in a short period. Industrially, this is accomplished via a lower compression of the electrode coating.
This leads to additional free space between the particles on the microstructure level, resulting in relatively high porosity with lower particle content.
However, the manufacture of energy cells has the opposite goal. In this case, high energy should be stored in the minimum possible space. This is accomplished via a greater compression of coatings, leading to relatively higher particle content and lower porosity.
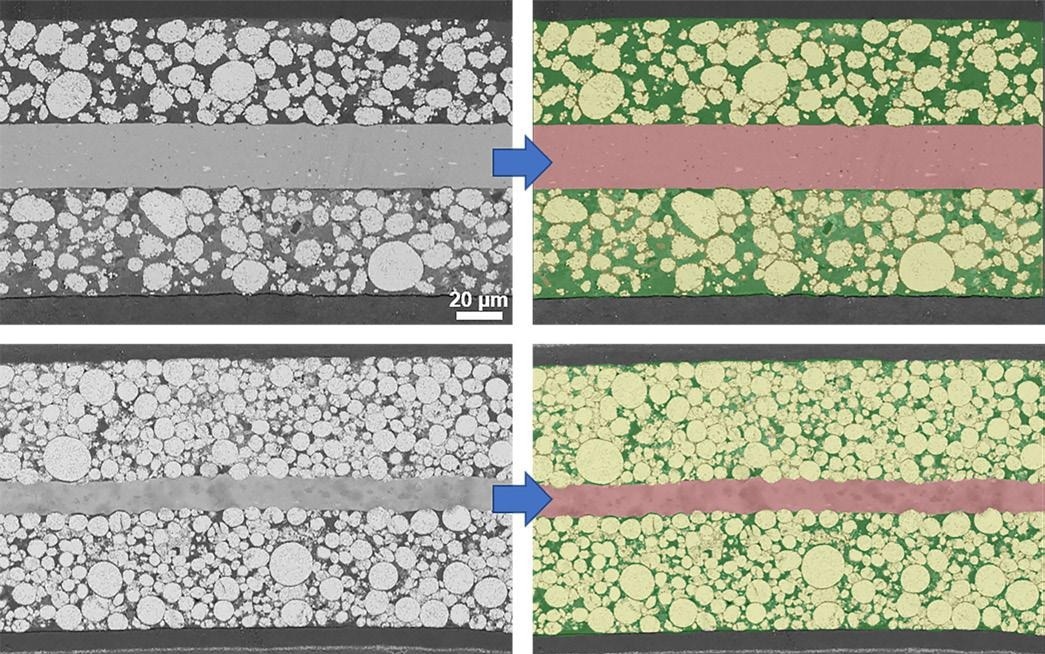
Figure 1. Comparison of cathodes from a lithium-ion power and energy cell imaged by SEM (scanning electron microscope) with RBSD detector, 10 kV. Top left: Power cell with large particles and high pore space between the particles. Bottom left: Energy cell with different particle sizes and low pore space between the particles. Top and bottom right: Segmented images with red (aluminum current collector), yellow (NCM storage particles), and green (free space between the particles). Image Credit: Carl Zeiss Microscopy GmbH
Table 1. Information on test samples. Source: Carl Zeiss Microscopy GmbH
| Sample |
LG INR 18650-HB6 |
LG INR 18650-MJ1 |
| Type / Requirements |
Power cell / High current |
Energy cell / High capacity |
| Max. discharge current [A] |
30 |
10 |
| Av. capacity [mAh] |
1500 |
3500 |
| Cathode chemistry |
NCM 523 |
NCM 811 |
Machine Learning-based Phase Analysis Using ZEN Intellesis
ZEN Intellesis can be an easy, quick, and highly reliable way to segment images for phase analysis. This is carried out using pixel classification based on machine-learning algorithms.
For this purpose, the user generates a segmentation model utilizing training data in the form of a subset of the images to be evaluated. The user must provide ZEN Intellesis with the required input to train the model. The phases to be segmented are marked by drawing (using the mouse) on the image in the labeling process.
Precisely labeling and covering distinctive regions, particularly boundaries, for each phase, should be prioritized over labeling large parts of the image. The amount of labeling should also be balanced and approximately equal for all phases. So-called feature vectors subsequently characterize the labeled pixels.
A feature vector is a set of specific properties or features of a pixel, such as color value or how it responds to image filter operations. The latter may include sensitivity to edges or neighboring pixels in different ranges. The dimension of a feature vector is determined by the number of features it considers.
The feature vector selection determines the segmentation model and how it performs. The feature vector is essentially the only parameter that must be set when utilizing ZEN Intellesis, and the user can select from a range of feature vectors.
ZEN Intellesis provides two basic feature vectors with either 25 or 33 predefined hand-picked and engineered features. These basic feature vectors are suitable for most images and applications.
For special cases, the user may choose one of the deep feature vectors, where features are extracted from different layers of a pre-trained deep neural network that first analyzes the image. Deep feature vectors are more computationally intensive as they have a dimension ranging from 50 to 256.
To train the segmentation model, the feature vectors of all labeled pixels are matched with their assigned phase information to result in a collection of decision trees.
Each of these trees can assign a phase to a pixel based on the features of that pixel, but was “grown” (i.e. derived) with slight, random variations during training. This type of classifier is known as a random forest, where the randomness increases the model’s prediction quality.
The final decision of phase assignment is made by respecting the majority vote of all trees.
The process of model training is iterative. The user can obtain a preview of the segmentation result at any time during labeling, allowing them to adjust the labeling accordingly, such as painting over incorrectly segmented pixels.
Once the segmentation result is deemed optimal, training is complete, and the model may be employed to segment single images, series, or stacks of images. Figure 2 presents an example of the labeling process in ZEN Intellesis, with the resulting segmentation preview included.
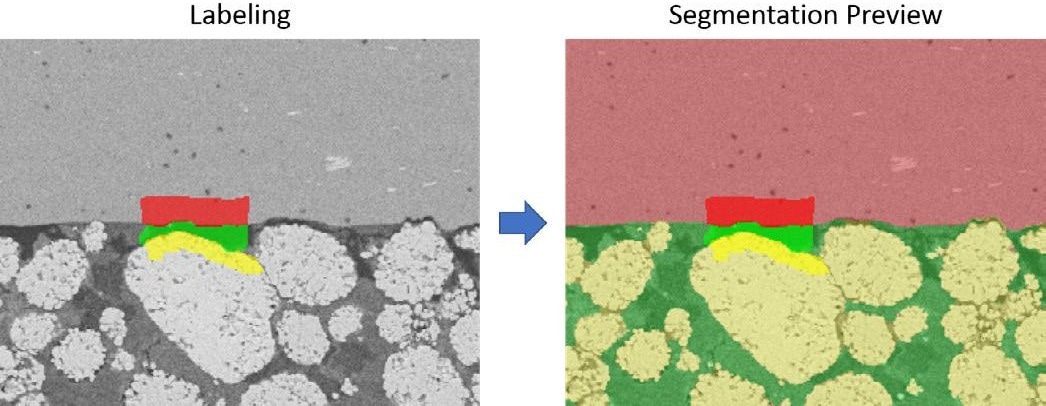
Figure 2. Segmentation using ZEN Intellesis; left: SEM image of a cathode from a power cell, RBSD detector, 10 kV, with painted labels for training the model; right: Preview of the resulting segmentation based on the labeling. Image Credit: Carl Zeiss Microscopy GmbH
Threshold-based Phase Analysis
For phase analysis with a global threshold, image segmentation is carried out by its 255 gray or color levels (in RGB mode, this translates to 255 levels for each red, green, and blue channel), and each phase is assigned to an intensity range.
The user manually chooses this range's lower and upper limits to ensure the pixels correspond as much as possible with the image areas of the respective phase. The gray values assigned to the different phases for a power cell image are detailed in Table 2.
Table 2. Assignment of gray value thresholds to phases in the image. Source: Carl Zeiss Microscopy GmbH
| Phase |
Lower gray value |
Upper gray value |
| Free space / Porosity |
51 |
142 |
| Current collector |
152 |
180 |
| Particle |
182 |
217 |
The image's histogram provides a visualization of the threshold-based segmentation, which displays the frequency of all color or gray values.
The vertical lines represent the thresholds at their corresponding position on the x-axis, and the histogram area between these lines represents all pixels that were counted for the given phase, as shown in Figure 3.
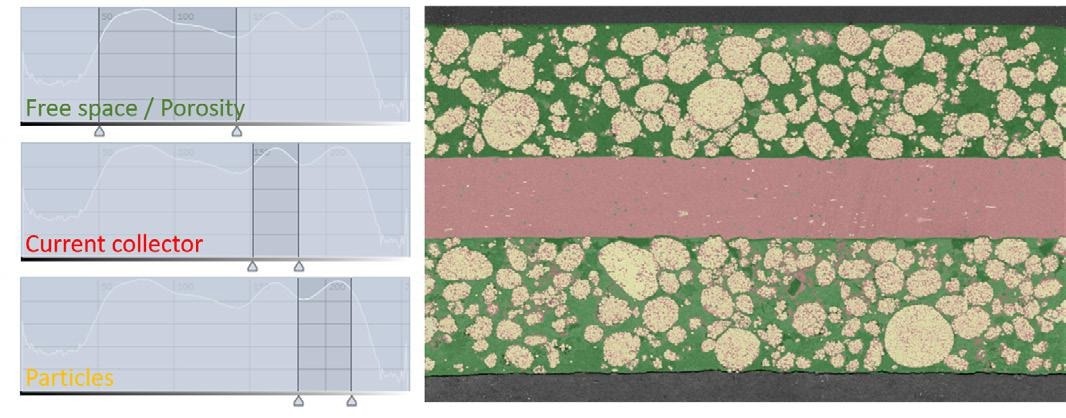
Figure 3. Segmentation using threshold values; left: Histogram with exemplary gray/color values of the particle content; right: Segmentation result. Image Credit: Carl Zeiss Microscopy GmbH
Results
A series of 15 SEM (scanning electron microscope) images of a cathode from an energy and power cell were assessed. A ZEN Intellesis model was utilized to segment the phases to provide a comparison with a threshold-value-based evaluation.
In both cases, one of the 15 images was utilized to train the model and derive the thresholds. The same model and threshold values were applied to the whole image series.
Figure 4 presents the segmented images. Here, a clear difference between the results obtained by ZEN Intellesis and threshold value segmentation is observed.
ZEN Intellesis appears to segment the SEM images with higher accuracy. The aluminum current collector (red) between the two layers is distinct from the rest of the image.
However, the images segmented via thresholding exhibit that some clusters in the current collector area are misclassified as particles (yellow) or porosity (green). This is because the current collector features gray values in some areas in the threshold ranges for the porosity and particle phases.
Since a pixel's color or gray value is the sole feature considered during threshold value-based segmentation, this causes false segmentation of phases with similar gray values. This may be mitigated by applying preprocessing options, e.g., Gaussian smoothing, to reduce or remove noise.
However, this also reduces the sharpness and quality of an image. An alternative option is the fine-tuning of the threshold ranges. Although, in this example, increasing the range for the current collector phase to include the misclassified clusters would result in removing even more pixels from the particle phase.
An example of this effect is in the chosen values for particles in the upper left area of the image in Figure 4.
The assignment of brighter areas to the current collector phase would result in the particle phase being further underestimated, and as a result, a tradeoff must be made.
For the image segmented by ZEN Intellesis, including more information about the texture and features of the image and the gray or color value, addresses these problems. Here, each phase is clearly and correctly assigned without the requirement for additional preprocessing.
The creation of a widely trained model for segmentation with ZEN Intellesis results in even batteries with different particle compositions (and differing gray values) being able to be evaluated by the same model.
For instance, SEM images with different gray levels depending on the image acquisition settings and specific sample material may still be segmented and evaluated more rapidly and consistently through a model trained in this manner that has learned to “understand” these differences.
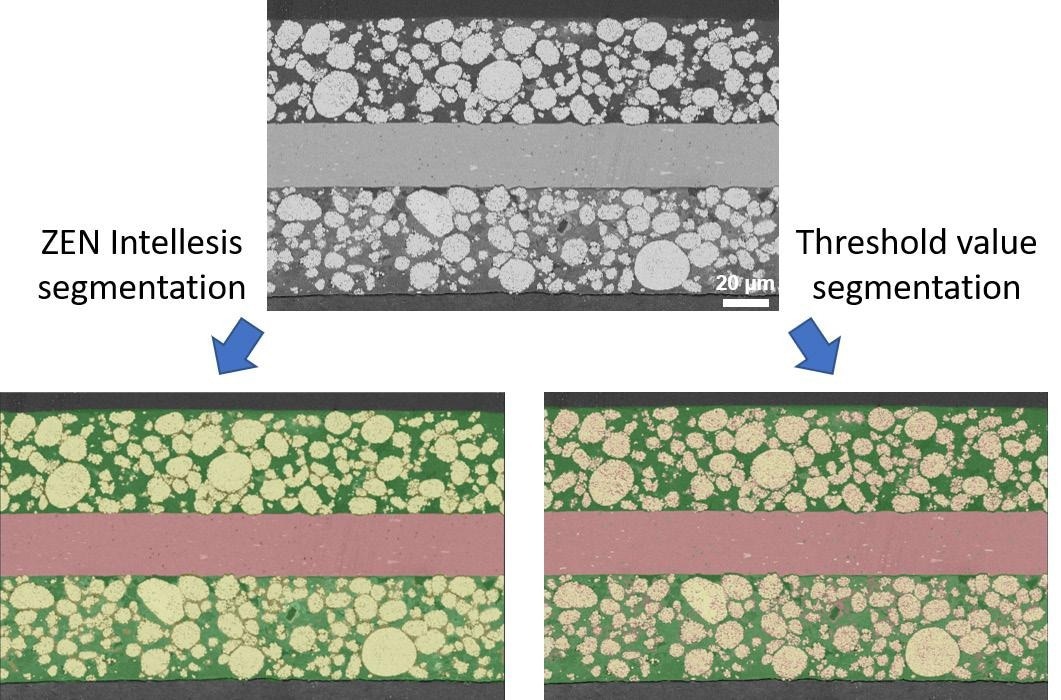
Figure 4. Direct comparison of segmentation results; top: SEM image of a cathode from a power cell, RBSD detector, 10 kV; bottom: Segmentation results using ZEN Intellesis (left) and threshold-based (right) segmentation. Image Credit: Carl Zeiss Microscopy GmbH
As the particle phase is of particular interest in this case, it is employed as a measure to compare the different evaluation methods. Figure 5 presents the determined particle content of the two evaluated cells (power and energy cells) using the described methods.
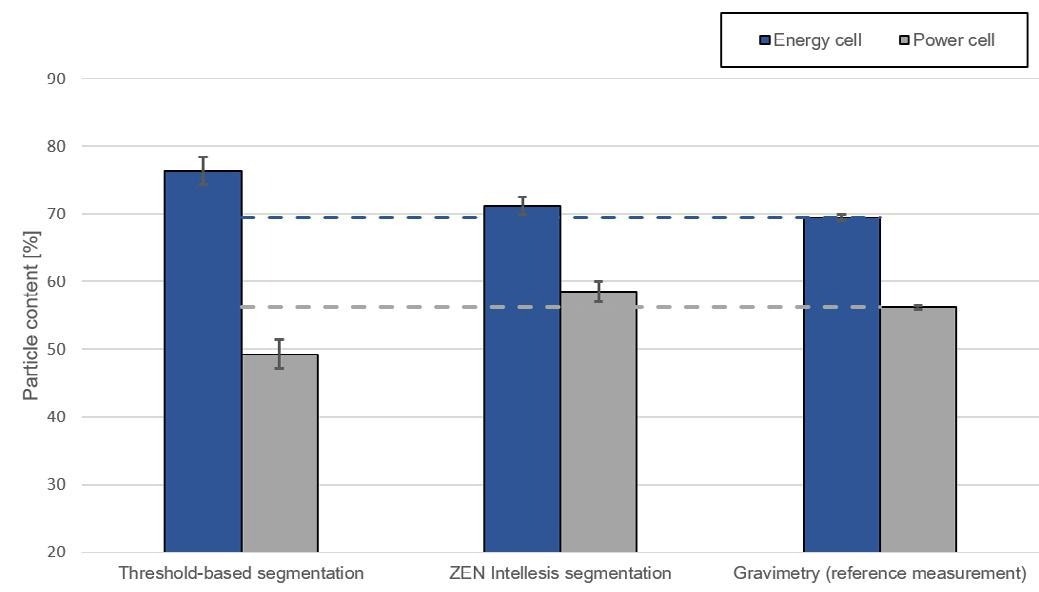
Figure 5. Direct comparison of evaluation of the particle content using the applied methods. Image Credit: Carl Zeiss Microscopy GmbH
The gravimetric value is used as the reference value. As already established from the impression of the image segmentation results, ZEN Intellesis delivers a more comparable result concerning gravimetric measurement than threshold-based evaluation.
On inspection of the results of threshold-based segmentation, it is evident that the particle content is lower than the reference for the power cell but higher for the power cell.
This is due to the similarity of gray levels within the images of the power and energy cell resulting in the under- and overestimation of the particle phase, respectively.
When considering further pixel-specific features in addition to the gray value, ZEN Intellesis achieves a more precise, robust and precise segmentation, resulting in good agreement with the reference value, as demonstrated in Figure 5.
Conclusion
Comparing the results of ZEN Intellesis and threshold-based segmentation to a gravimetric reference measurement reveals that ZEN Intellesis provides a quick and robust method for image segmentation.
ZEN Intellesis is less susceptible to under- or overestimation of segmented phases, making it well-suited for reliable and repeatable quantitative microstructural analysis.
Acknowledgments
Produced from materials originally authored by Alexander Banholzer, Tim Schubert, Timo Bernthaler, and Gerhard Schneider at the Institute for Materials Research, University Aalen; and Tobias Volkenandt at Carl Zeiss Microscopy GmbH, Oberkochen.

This information has been sourced, reviewed and adapted from materials provided by Carl Zeiss Microscopy GmbH.
For more information on this source, please visit Carl Zeiss Microscopy GmbH.