Sponsored by MerckReviewed by Emily MageeJan 23 2024
Fluorescence microscopy plays a crucial role in numerous biological investigations, impacting everything from basic research to clinical diagnostics.
Unlike other imaging modalities like electron microscopy, ultrasound, and computed tomography, fluorescence microscopy couples targeted, multispectral contrast with high spatial resolution.1,2
While fluorescent proteins and organic fluorophores remain key resources in biology and biotechnology laboratories, alternate fluorescent nanomaterials are being utilized in global research laboratories. They have diverse applications, spanning from in vivo deep tissue imaging3,4 to point-of-care diagnostics.5
Unlike most organic fluorophores, which typically measure below 1 nm, nanomaterials range between 1 and 100 nm, allowing them to function as distinct entities with a loadable surface. The success of fluorescent nanomaterials in various applications stems from their advantageous capabilities, including:
- Providing high optical contrast in samples without contrast
- Facilitating the visualization or detection of specific components within intricate biological systems
- Enabling the visualization of structures with exceptionally high spatial and temporal resolutions—well below 100 nm in size and within millisecond timescales
- Allowing the quantification of physical properties (like temperature, strain, and magnetic fields) and biochemical properties (such as concentration of ions and molecules, and pH) at the subcellular level
- Enabling targeted delivery of payloads in alignment with specific targets
Figure 1 shows an 'ideal' nanoparticle. This material would exhibit high fluorescence brightness consistently across various particles, no photo-bleaching, flawless biocompatibility, and highly specific binding to, or detection of, the target analyte.
However, the optimal size of a nanomaterial varies significantly based on the application and the size of the objects being studied.
Even though the flawless nanoparticle remains elusive, significant progress has been achieved in the field. This article will review current cutting-edge materials, focusing on aspects like fluorescence brightness, photostability, and size, and connect them to emerging applications.
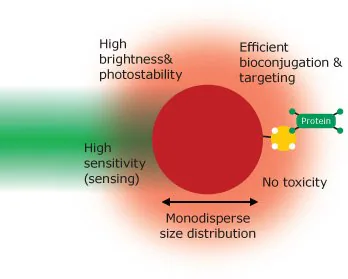
Figure 1. The properties of an ‘ideal’ fluorescent nanomaterial. Image Credit: Merck
Brightness
Fluorescence brightness stands as a crucial trait in every fluorescent nanomaterial. Adequate brightness is essential to display a distinct signal amidst the often autofluorescent background inherent in biological systems.
The fluorescence brightness (B) is the product of the absorption coefficient (ε) and quantum yield (Γ): B = ε Γ. A bright material needs to efficiently emit absorbed excitation light— that is, a high fluorescence quantum yield. Additionally, it must effectively absorb photons, implying a high absorption coefficient.
The latter is commonly measured in terms of moles, such as [M-1cm-1], without considering the material's physical size. However, size plays a significant role.
Organic dyes, typically around 1 nm in diameter, are considerably smaller (about 10 to 100 times) than most fluorescent nanoparticles. For instance, a semiconductor-based quantum dot (QD) might absorb light around 10 times more efficiently than an organic dye, but it also tends to have a volume more than 100 times larger.
Determining which material is brighter often hinges on whether the comparison relies on molecule/particle counts (plus a molar extinction coefficient) or the mass of the materials (plus a mass-based extinction coefficient).6
These two measures of brightness are showcased in Table 1 for six distinct types of nanomaterials. The molar brightness of molecular fluorophores, such as fluorescein and green fluorescent protein (GFP), is surpassed by various materials.
Nevertheless, owing to the compact size of molecules like fluorescein, the mass brightness surpasses that of other molecules by more than an order of magnitude.
Table 1. Comparison of the molar and mass-based fluorescence brightness of selected fluorescent nanomaterials. Mass-based brightness values are estimated, based on molecular weight, particle sizes, and densities. Source: Merck
| Material |
Size
[nm] |
Molar brightness
M-1cm-1 |
Mass brightness
(g/L)-1cm-1 |
References |
| Fluorescein |
<1 |
72000 |
215 |
11 |
| Green fluorescent protein |
~3 |
33000 |
1.2 |
12 |
| Carbon dot |
3 |
4000 |
0.2 |
13 |
| CdSeS/ZnS quantum dot |
6 |
240000 |
1.1 |
6 |
| Polymer dot |
10 |
3000000 |
10 |
6 |
| Nanodiamond |
100 |
1700000 |
0.002 |
15 |
A single 100 nm nanodiamond or a 10 nm polymer dot outshines the brightness of a fluorescein molecule by more than tenfold, albeit with a larger particle size.
However, larger particles do not always pose drawbacks and are at times necessary, especially in biological contexts—such as evading immediate clearance in in vivo experiments.
The identification of rare events, whereby the unequivocal detection of individual particles is crucial, can be improved by the exceptionally high molar brightness of larger particles (also discussed in the 'Size' section).
Broadly, mass brightness tends to favor small and low-density materials. For instance, carbon dots exhibit reasonable mass brightness, yet the molar brightness falls significantly compared to other materials.
Molar brightness primarily stems from the realm of molecules and overlooks the size of nanoparticles. Therefore, the most pertinent measure of brightness selection depends on the specific particle and the intended application.
Organic dyes typically absorb light very efficiently, due to the entire molecule engaging with light through delocalized electrons.
In contrast, nanodiamonds predominately comprise a transparent diamond matrix, with only 0.001 % by weight occupied by "color centers," like nitrogen-vacancy (NV) centers responsible for light absorption and fluorescence.7
There is therefore immense room for enhancement. The extinction and brightness of semiconductor quantum dots and polymer dots surge as the size increases.8,9
Nanodiamonds stand out as one of the few materials where the potential for brightness improvement lies in enhancing the quality of NV centers. Ongoing efforts aim to develop gentle methods of micron-sized particle fragmentation or employ bottom-up synthesis to create particles housing NV centers.10
Photostability
In most applications, multiple cycles involve exciting nanomaterials and the collection of the fluorescence signal. Even in basic in vitro cellular imaging experiments (requiring only a few images), pinpointing a specific area of interest usually demands several seconds of light excitation.
Therefore, photostability emerges as a critical factor—a highly luminous fluorescent material becomes futile if its intensity diminishes too rapidly.
This fading, known as "photobleaching," involves complex physiochemical changes, highly specific to the material and greatly influenced by the local environment and light intensity.
Many materials can display either high or low photostability, contingent upon the environment and illumination intensity used.
This variability contributes to the dearth of quantitative data on the photostability of fluorescent nanomaterials in scientific literature. While extensively used fluorophores like fluorescein have been comprehensively studied,16,17 most newer materials lack such detailed examination.
There are two primary measures of photostability: absolute or lifetime photostability (which quantifies the average number of photons a fluorophore can emit before becoming inactive), and photobleaching rate (indicating the decrease in fluorescence intensity per unit of time).
Absolute photostability remains consistent across a wide range of excitation intensities but is experimentally challenging to measure. On the other hand, the photobleaching rate is more readily measurable but heavily reliant on the intensity of illumination.
With fluorescence intensity as a function of time for various fluorescent nanomaterials suspended in water and visualized using a commercial wide-field fluorescence microscope.4
It has been demonstrated that illumination intensities of approximately 10 W cm-2, are quite moderate compared to the typical excitation intensities employed in confocal microscopy (10–100 W cm-2), up-conversion nanoparticle imaging (100–1000 W cm-2),18 and stimulated emission depletion super-resolution imaging (>1000 W cm-2).19
For instance, Alexa 647, is a common red fluorophore that exhibits a characteristic photobleaching time (the inverse of the photobleaching rate) of approximately 8 seconds in these conditions.
Conversely, nanodiamonds exhibit no photobleaching whatsoever; instead, the most significant variability arises from excitation intensity drift. All other materials display photobleaching characteristics between these two extremes.
In practical terms, brightness and photostability are closely intertwined: a brighter material can be excited at lesser light intensities, achieving similar image contrast to a less bright fluorophore.
Consequently, the suitable measure of photostability varies depending on the application.
Size of Fluorescent Nanoprobes
The size of nanomaterials significantly influences how they interact with biological systems. It impacts various aspects such as active and passive cell uptake, transport processes, immune responses, clearance pathways, and toxicity.20
Moreover, size plays a crucial role in physical and chemical processes like diffusion, ionic interactions, and chemical bond formation. As with the previously described characteristics, ideal particle size varies greatly based on the specific application.
In intricate biological environments like serum, blood, or growth media, the formation of a protein corona complicates the determination of nanoparticle size considerably.20,21
Table 2 outlines general considerations regarding the suitability of nanomaterials within specific size ranges for various applications and research needs.
To explore how systems work, it is vital to consider the size of the fluorescent nanomaterial in relation to the other elements involved in the process.
For instance, when investigating the dynamics of individual molecules, only the smallest fluorescent labels are necessary, as the larger nanoparticles' inertia could disrupt or completely stop most of these processes.
In contrast, if investigating intracellular transport along microtubules, opting for nanoparticles up to tens of nanometers could work well. These individual particles offer better contrast (thus potentially higher temporal resolution) and greater photostability.
Eukaryotic cells typically transport larger items like vesicles and organelle parts via motor proteins, and a 30 nm nanoparticle may only minimally affect transport dynamics.22 Furthermore, size directly impacts how cells take in particles.23
Table 2. Main nanomaterials size regimes for biomedical applications. Source: Merck
| Application / Requirement |
Size [nm] |
| Molecular dynamics |
<1 nm |
| Good clearance in vivo |
<5 nm |
| Single particle tracking |
<100 nm |
| Targeting in vivo |
150–250 nm |
In in vivo experiments, interactions tend to be even more intricate and less thoroughly understood. The scientific community only agrees on a few aspects concerning the impacts of nanomaterial size.
Generally, nanomaterials need a hydrodynamic radius (including attached biological substances) below 5.5 nm for renal clearance. 24
The liver clears particles up to about ~200 nm, while the spleen filters larger ones.25 Particles approximately ~150 nm in size are believed to be ideal for evading spleen clearance and enhancing targeting potential because they circulate longer.26
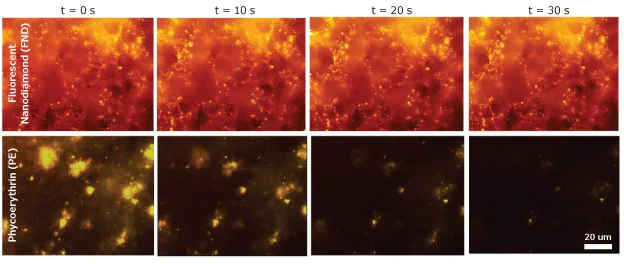
Figure 3. Time-lapse of blood clots incubated with a biotinylated platelet activation antibody (anti-CD41-biotin), incubated with streptavidin conjugated to either fluorescent nanodiamond (top) or phycoerythrin (PE) (bottom). PE quickly degrades, while the fluorescent nanodiamond (FNDs) signal remains constant. Image Credit: Merck
Applications
Photostable fluorophores currently serve to monitor biological processes over time through extended imaging,27 aiding in cell tracking28 and imaging entire organisms across several days.29
Figure 3 illustrates how image quality deteriorates rapidly at high magnification during imaging experiments. While an initial image set is captured, fine-tuning the field of view focus without compromising quality proves challenging.
Near-infrared (NIR) emission is crucial for in vivo imaging,30,31 a characteristic present in various nanomaterials like quantum dots and nanodiamonds.
In in vivo clinical applications, these materials find potential in fluorescence-guided surgeries, preventing the bleaching of tumor markers.32 The brightness of these markers at wavelengths that penetrate tissues is pivotal for effective in vivo imaging.
Photostable nanomaterials play a vital role in new applications employing high laser intensities where photobleaching is a major limiting factor. For instance, nanodiamonds can endure intensities surpassing 100 MW cm-2 without bleaching.34
In super-resolution imaging, which achieves resolutions below the diffraction limit, photostability holds both direct and indirect significance. Directly, fluorophores must endure high excitation intensities for prolonged periods.
Indirectly, in stimulated emission depletion (STED) microscopy, where resolution generally improves with higher excitation power, better photostability proves beneficial. 35
Ultimately, particle size36 limits resolution, yet imaging individual NV centers with a resolution as fine as 6 nm is possible.37 Nanodiamonds, capable of enduring high laser intensities, enable the highest achievable image resolution.38
In stochastic optical reconstruction microscopy (STORM), while not directly enhancing cellular contrast, nanodiamonds function as fiducial markers to correct stage drift.
This facilitates the acquisition of images at resolutions of 10 nm39 (with demonstrations as low as 2.6 nm40) and up to 26 multiplex rounds—an unparalleled feat for superresolution techniques.40
In multiphoton microscopy, high-resolution fluorescence images can be captured deep within tissues, reaching depths of hundreds of microns below the tissue surface. Multiphoton excitation permits precise light focusing inside the tissue, enabling optical cross-sectioning and reducing background fluorescence.41,42
Even with a reduced excitation area, increased local laser intensities in the focal point can still cause photobleaching.43,44
Two-photon excitation has successfully imaged fluorescent nanodiamonds (FND) in MCF-7 breast cancer (at 800 nm excitation)45 and HeLa cells, exhibiting significantly enhanced contrast by minimizing background fluorescence.46,47
In vitro, visualization of particles as small as 40 nm has been achieved47 under high illumination conditions (up to 3 GW cm-2 and up to 10 minutes), with no observed bleaching for two-photon emission.46,48
The instances where photostable materials excel have been highlighted, yet photobleaching itself holds potential as an imaging technique. Historical techniques such as fluorescence recovery after photobleaching (FRAP) were utilized to ascertain molecular diffusion rates.
Recently, photobleaching-assisted STORM improved the attainable signal-to-noise of this method, particularly useful for highly autofluorescent analytes.49
Photobleaching can also act as a contrast mechanism for multiplexed imaging when the various photobleaching times of different dyes can be used to create signal channel contrast.50
Fluorescent nanomaterials offer various contrast mechanisms, paving the way for multimodal imaging to enhance both resolution and sensitivity.
These materials may complement magnetic resonance,51 electron microscopy,52 and computed tomography53 imaging techniques in the future, extending beyond research laboratories into operating rooms, for instance.
Conclusion
The current generation of fluorescent nanomaterials is driving substantial progress in biological imaging. Choosing the optimal material for a particular application involves a complex evaluation, considering factors like brightness, photostability, biological safety, sensing ability, and size of the nanomaterial.
The outdated query of "Which material is the best?" gives way to more pertinent questions, such as "Which material is best for my application?" Pinpointing the ideal material and adjusting experimental procedures accordingly is no simple task.
Consequently, many promising materials remain underutilized, necessitating strong collaborations between materials scientists and biologists to maximize their potential. Numerous current fluorescent nanomaterials showcase unprecedented fluorescence brightness.
Among them, nanodiamond stands out, boasting genuine, enduring resistance against photodegradation and unique sensing capabilities.
References and Further Reading
- Falati S, Gross P, Merrill-Skoloff G, Furie BC, Furie B. 2002. Real-time in vivo imaging of platelets, tissue factor and fibrin during arterial thrombus formation in the mouse. Nat Med. 8(10):1175-1180. https://doi.org/10.1038/nm782
- FURIE B, FURIE BC. In vivo thrombus formation. 512-17. https://doi.org/10.1111/j.1538-7836.2007.02482.x
- Miller DR, Jarrett JW, Hassan AM, Dunn AK. 2017. Deep tissue imaging with multiphoton fluorescence microscopy. Current Opinion in Biomedical Engineering. 432-39. https://doi.org/10.1016/j.cobme.2017.09.004
- Reineck P, Gibson BC. 2017. Near-Infrared Fluorescent Nanomaterials for Bioimaging and Sensing. Advanced Optical Materials. 5(2):1600446. https://doi.org/10.1002/adom.201600446
- Quesada-González D, Merkoçi A. Nanomaterial-based devices for point-of-care diagnostic applications. Chem. Soc. Rev.. 47(13):4697-4709. https://doi.org/10.1039/c7cs00837f
- Reineck P, Francis A, Orth A, Lau DWM, Nixon?Luke RDV, Rastogi ID, Razali WAW, Cordina NM, Parker LM, Sreenivasan VKA, et al. 2016. Brightness and Photostability of Emerging Red and Near?IR Fluorescent Nanomaterials for Bioimaging. Advanced Optical Materials. 4(10):1549-1557. https://doi.org/10.1002/adom.201600212
- Shenderova OA, McGuire GE. 2015. Science and engineering of nanodiamond particle surfaces for biological applications (Review). Biointerphases. 10(3):030802. https://doi.org/10.1116/1.4927679
- Yu WW, Qu L, Guo W, Peng X. 2003. Experimental Determination of the Extinction Coefficient of CdTe, CdSe, and CdS Nanocrystals. Chem. Mater.. 15(14):2854-2860. https://doi.org/10.1021/cm034081k
- Sun K, Chen H, Wang L, Yin S, Wang H, Xu G, Chen D, Zhang X, Wu C, Qin W. 2014. Size-Dependent Property and Cell Labeling of Semiconducting Polymer Dots. ACS Appl. Mater. Interfaces. 6(13):10802-10812. https://doi.org/10.1021/am502733n
- Alkahtani MH, Alghannam F, Jiang L, Almethen A, Rampersaud AA, Brick R, Gomes CL, Scully MO, Hemmer PR. 2018. Fluorescent nanodiamonds: past, present, and future. 7(8):1423-1453. https://doi.org/10.1515/nanoph-2018-0025
- Sjöback R, Nygren J, Kubista M. 1995. Absorption and fluorescence properties of fluorescein. Spectrochimica Acta Part A: Molecular and Biomolecular Spectroscopy. 51(6):L7-L21. https://doi.org/10.1016/0584-8539(95)01421-p
- McRae SR, Brown CL, Bushell GR. 2005. Rapid purification of EGFP, EYFP, and ECFP with high yield and purity. Protein Expression and Purification. 41(1):121-127. https://doi.org/10.1016/j.pep.2004.12.030
- Castro HPS, Pereira MK, Ferreira VC, Hickmann JM, Correia RRB. 2017. Optical characterization of carbon quantum dots in colloidal suspensions. Opt. Mater. Express. 7(2):401. https://doi.org/10.1364/ome.7.000401
- Wu C, Jin Y, Schneider T, Burnham DR, Smith PB, Chiu DT. 2010. Ultrabright and Bioorthogonal Labeling of Cellular Targets Using Semiconducting Polymer Dots and Click Chemistry. Angew. Chem.. 122(49):9626-9630. https://doi.org/10.1002/ange.201004260
- Schirhagl R, Chang K, Loretz M, Degen CL. 2014. Nitrogen-Vacancy Centers in Diamond: Nanoscale Sensors for Physics and Biology. Annu. Rev. Phys. Chem.. 65(1):83-105. https://doi.org/10.1146/annurev-physchem-040513-103659
- Widengren J, Rigler R. 1996. Bioimaging. [Internet]. 4, 149–157.:
- Spikes JD. 1984. QUANTUM YIELDS AND KINETICS OF THE PHOTOBLEACHING OF HEMATOPORPHYRIN, PHOTOFRIN II, TETRA(4-SULFONATOPHENYL)-PORPHINE AND UROPORPHYRIN. Photochem Photobiol. 39(6):797-808. https://doi.org/10.1111/j.1751-1097.1984.tb08388.x
- Nadort A, Zhao J, Goldys EM. Lanthanide upconversion luminescence at the nanoscale: fundamentals and optical properties. Nanoscale. 8(27):13099-13130. https://doi.org/10.1039/c5nr08477f
- Pàmies P. 2015. Resolution power. Nature Mater. 14(10):966-966. https://doi.org/10.1038/nmat4442
- Shang L, Nienhaus K, Nienhaus G. 2014. Engineered nanoparticles interacting with cells: size matters. Journal of Nanobiotechnology. 12(1):5. https://doi.org/10.1186/1477-3155-12-5
- Moore TL, Rodriguez-Lorenzo L, Hirsch V, Balog S, Urban D, Jud C, Rothen-Rutishauser B, Lattuada M, Petri-Fink A. Nanoparticle colloidal stability in cell culture media and impact on cellular interactions. Chem. Soc. Rev.. 44(17):6287-6305. https://doi.org/10.1039/c4cs00487f
- Haziza S, Mohan N, Loe-Mie Y, Lepagnol-Bestel A, Massou S, Adam M, Le XL, Viard J, Plancon C, Daudin R, et al. 2017. Fluorescent nanodiamond tracking reveals intraneuronal transport abnormalities induced by brain-disease-related genetic risk factors. Nature Nanotech. 12(4):322-328. https://doi.org/10.1038/nnano.2016.260
- Hoshyar N, Gray S, Han H, Bao G. 2016. The effect of nanoparticle size on in vivo pharmacokinetics and cellular interaction. Nanomedicine. 11(6):673-692. https://doi.org/10.2217/nnm.16.5
- Soo Choi H, Liu W, Misra P, Tanaka E, Zimmer JP, Itty Ipe B, Bawendi MG, Frangioni JV. 2007. Renal clearance of quantum dots. Nat Biotechnol. 25(10):1165-1170. https://doi.org/10.1038/nbt1340
- Ernsting MJ, Murakami M, Roy A, Li S. 2013. Factors controlling the pharmacokinetics, biodistribution and intratumoral penetration of nanoparticles. Journal of Controlled Release. 172(3):782-794. https://doi.org/10.1016/j.jconrel.2013.09.013
- Moghimi S, Hunter A, Andresen T. 2012. Factors Controlling Nanoparticle Pharmacokinetics: An Integrated Analysis and Perspective. Annu. Rev. Pharmacol. Toxicol.. 52(1):481-503. https://doi.org/10.1146/annurev-pharmtox-010611-134623
- Montalti M, Cantelli A, Battistelli G. Nanodiamonds and silicon quantum dots: ultrastable and biocompatible luminescent nanoprobes for long-term bioimaging. Chem. Soc. Rev.. 44(14):4853-4921. https://doi.org/10.1039/c4cs00486h
- Montalti M, Cantelli A, Battistelli G. Nanodiamonds and silicon quantum dots: ultrastable and biocompatible luminescent nanoprobes for long-term bioimaging. Chem. Soc. Rev.. 44(14):4853-4921. https://doi.org/10.1039/c4cs00486h
- Montalti M, Cantelli A. Nanodiamonds and silicon quantum dots: ultrastable and biocompatible luminescent nanoprobes for long-term bioimaging. Chem. Soc. Rev.. 44(14):4853-4921. https://doi.org/10.1039/c4cs00486h
- Montalti M, Cantelli A, Battistelli G. Nanodiamonds and silicon quantum dots: ultrastable and biocompatible luminescent nanoprobes for long-term bioimaging. Chem. Soc. Rev.. 44(14):4853-4921. https://doi.org/10.1039/c4cs00486h
- Harmsen S, Teraphongphom N, Tweedle MF, Basilion JP, Rosenthal EL. 2017. Optical Surgical Navigation for Precision in Tumor Resections. Mol Imaging Biol. 19(3):357-362. https://doi.org/10.1007/s11307-017-1054-1
- Haque A, Faizi MSH, Rather JA, Khan MS. 2017. Next generation NIR fluorophores for tumor imaging and fluorescence-guided surgery: A review. Bioorganic & Medicinal Chemistry. 25(7):2017-2034. https://doi.org/10.1016/j.bmc.2017.02.061
- Vaijayanthimala V, Cheng P, Yeh S, Liu K, Hsiao C, Chao J, Chang H. 2012. The long-term stability and biocompatibility of fluorescent nanodiamond as an in vivo contrast agent. Biomaterials. 33(31):7794-7802. https://doi.org/10.1016/j.biomaterials.2012.06.084
- Tajiri K, Kishi H, Ozawa T, Sugiyama T, Muraguchi A. 2009. SFMAC: A novel method for analyzing multiple parameters on lymphocytes with a single fluorophore in cell-microarray system. Cytometry. 75A(4):282-288. https://doi.org/10.1002/cyto.a.20675
- Arroyo-Camejo S, Adam M, Besbes M, Hugonin J, Jacques V, Greffet J, Roch J, Hell SW, Treussart F. 2013. Stimulated Emission Depletion Microscopy Resolves Individual Nitrogen Vacancy Centers in Diamond Nanocrystals. ACS Nano. 7(12):10912-10919. https://doi.org/10.1021/nn404421b
- Harke B, Keller J, Ullal CK, Westphal V, Schönle A, Hell SW. 2008. Resolution scaling in STED microscopy. Opt. Express. 16(6):4154. https://doi.org/10.1364/oe.16.004154
- Tzeng Y, Faklaris O, Chang B, Kuo Y, Hsu J, Chang H. 2011. Superresolution Imaging of Albumin-Conjugated Fluorescent Nanodiamonds in Cells by Stimulated Emission Depletion. Angew. Chem. Int. Ed.. 50(10):2262-2265. https://doi.org/10.1002/anie.201007215
- Rittweger E, Han KY, Irvine SE, Eggeling C, Hell SW. 2009. STED microscopy reveals crystal colour centres with nanometric resolution. Nature Photon. 3(3):144-147. https://doi.org/10.1038/nphoton.2009.2
- Hsiao WW, Hui YY, Tsai P, Chang H. 2016. Fluorescent Nanodiamond: A Versatile Tool for Long-Term Cell Tracking, Super-Resolution Imaging, and Nanoscale Temperature Sensing. Acc. Chem. Res.. 49(3):400-407. https://doi.org/10.1021/acs.accounts.5b00484
- Yi J, Manna A, Barr VA, Hong J, Neuman KC, Samelson LE. Highly Multiplexed, Super-resolution Imaging of T Cells Using madSTORM. JoVE.(124): https://doi.org/10.3791/55997
- Yi J, Manna A, Barr VA, Hong J, Neuman KC, Samelson LE. 2016. madSTORM: a superresolution technique for large-scale multiplexing at single-molecule accuracy. MBoC. 27(22):3591-3600. https://doi.org/10.1091/mbc.e16-05-0330
- Yi J, Manna A, Barr VA, Hong J, Neuman KC, Samelson LE. 2016. madSTORM: a superresolution technique for large-scale multiplexing at single-molecule accuracy. MBoC. 27(22):3591-3600. https://doi.org/10.1091/mbc.e16-05-0330
- Yi J, Manna A, Barr VA, Hong J, Neuman KC, Samelson LE. 2016. madSTORM: a superresolution technique for large-scale multiplexing at single-molecule accuracy. MBoC. 27(22):3591-3600. https://doi.org/10.1091/mbc.e16-05-0330
- Patterson G, Piston DW. 2000. Biophys. J.2000, 78, 2159–2162. [Internet].
- Hopt A, Neher E. 2001. Biophys. J.2001, 80, 2029–2036. [Internet].
- Jimenez CM, Knezevic NZ, Rubio YG, Szunerits S, Boukherroub R, Teodorescu F, Croissant JG, Hocine O, Seric M, Raehm L, et al. Nanodiamond?PMO for two-photon PDT and drug delivery. J. Mater. Chem. B. 4(35):5803-5808. https://doi.org/10.1039/c6tb01915c
- Chang Y, Lee H, Chen K, Chang C, Tsai D, Fu C, Lim T, Tzeng Y, Fang C, Han C, et al. 2008. Mass production and dynamic imaging of fluorescent nanodiamonds. Nature Nanotech. 3(5):284-288. https://doi.org/10.1038/nnano.2008.99
- Hui YY, Zhang B, Chang Y, Chang C, Chang H, Hsu J, Chang K, Chang F. 2010. Two-photon fluorescence correlation spectroscopy of lipid-encapsulated fluorescent nanodiamonds in living cells. Opt. Express. 18(6):5896. https://doi.org/10.1364/oe.18.005896
- Wee T, Tzeng Y, Han C, Chang H, Fann W, Hsu J, Chen K, Yu Y. 2007. Two-photon Excited Fluorescence of Nitrogen-Vacancy Centers in Proton-Irradiated Type Ib Diamond?. J. Phys. Chem. A. 111(38):9379-9386. https://doi.org/10.1021/jp073938o
- Zhan Y, Liu Y, Zeng Q. Photobleaching Enables Super-resolution Imaging of the FtsZ Ring in the Cyanobacterium Prochlorococcus. JoVE.(141): https://doi.org/10.3791/58603
- Orth A, Ghosh RN, Wilson ER, Doughney T, Brown H, Reineck P, Thompson JG, Gibson BC. 2018. Super-multiplexed fluorescence microscopy via photostability contrast. Biomed. Opt. Express. 9(7):2943. https://doi.org/10.1364/boe.9.002943
- Taylor RM, Huber DL, Monson TC, Ali AS, Bisoffi M, Sillerud LO. 2011. Multifunctional iron platinum stealth immunomicelles: targeted detection of human prostate cancer cells using both fluorescence and magnetic resonance imaging. J Nanopart Res. 13(10):4717-4729. https://doi.org/10.1007/s11051-011-0439-3
- Prabhakar N, Peurla M, Koho S, Deguchi T, Näreoja T, Chang H, Rosenholm JM, Hänninen PE. 2018. STED-TEM Correlative Microscopy Leveraging Nanodiamonds as Intracellular Dual-Contrast Markers. Small. 14(5):1701807. https://doi.org/10.1002/smll.201701807
- Scheers I, Palermo JJ, Freedman S, Wilschanski M, Shah U, Abu-El-Haija M, Barth B, Fishman DS, Gariepy C, Giefer MJ, et al. 2018. Recommendations for Diagnosis and Management of Autoimmune Pancreatitis in Childhood. Journal of Pediatric Gastroenterology and Nutrition. 67(2):232-236. https://doi.org/10.1097/mpg.0000000000002028

This information has been sourced, reviewed, and adapted from materials provided by Merck.
For more information on this source, please visit Merck.