Areas of different characteristic composition from X-ray map data can be automatically found using AZtecEnergy AutoPhaseMap software from Oxford Instruments and the area, distribution, constituent elements and composition of these phases or areas are determined.
The article studies how this can be used for studying the distribution and chemistry of nanoscale intermetallic phases in an Ni-based alloy, which are on the scale of 150-1000nm.
Automatic Phase Mapping and Phase Identification
The sample used in this demonstration was a nickel-based alloy from a spinner bowl used for manufacturing fibre glass. Intermetallic precipitates offer strength to the alloy at high temperatures.
The precipitate distribution as shown in Figure 1a is on the nanoscale down to around 100nm. The data was collected on a FEG-SEM at 5kV to reduce beam diameter and X-ray interaction volume. The high voltage was sufficient to excite the L lines of the transition metals (Cr, Fe and Ni), and also lines from the precipitate-forming elements (Nb L, Mo L and W M), as seen in the spectrum collected from the entire field of view as shown in Figure 1b.
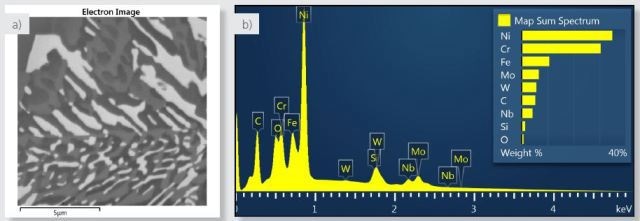
Figure 1. a) Electron image of the area analysed. b) spectrum of the area analysed from the sum of all X-ray data collected during X-ray SmartMap acquisition.
As shown in Table 1 below, in order to study the chemistry and distribution of the precipitates, an X-ray smart map was obtained from an area of the sample under the conditions shown.
Table 1. Parameters for SmartMap Acquisition.
| SEM Type |
FEG Gun |
| Acquisition time (min) |
50 |
| Acquisition Rate (cps) |
5500 |
| Accelerating Voltage (kV) |
5 |
| Map resolution |
512x512 |
| No of pixels |
262144 |
| Counts per pixel |
63 |
X-ray maps as shown in Figure 2 calculated from the SmartMap data suggest presence of three phases as shown by different grey levels in the electron image. The maps are colored R, G and B.
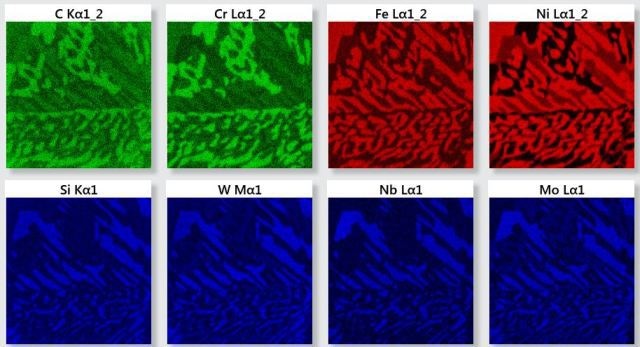
Figure 2. X-ray maps for the elements identified in the analyzed area.
During acquisition, the AutoPhaseMap is calculated from the mapping data and the presence of three phases is confirmed as shown in Figure 3a. The software identified these phases as NiCrFe, NiCrMoNb, and CrNiC. Figure 3c shows the comparative abundance of these phases in the area analyzed.
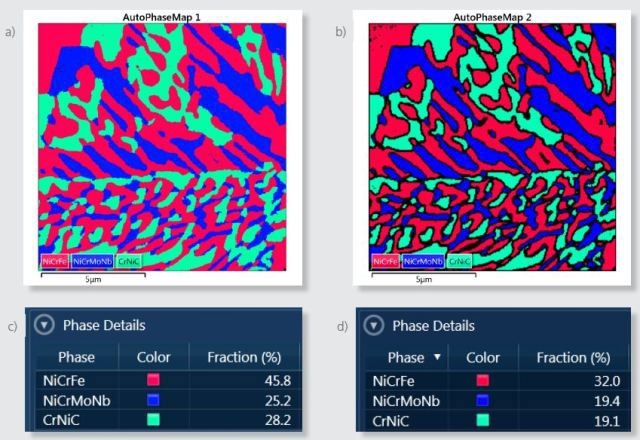
Figure 3. a) Default AutoPhaseMap image for the area analyzed. b) AutoPhaseMap image calculated using parameters that reject pixels from boundaries with X-ray signals from more than one phase. c) Phase distribution for the default AutoPhaseMap image. d) Phase distribution for the AutoPhaseMap calculated with boundaries rejected.
Figure 4a shows NiCrFe signifying the bulk of the sample, a nickel-based alloy and the composition and spectra determined for this phase. The strengthening precipitate phase is NiCrMoNb where the molybdenum and niobium are concentrated as seen in Figure 4b. CrNiC has a higher carbon concentration as shown in Figure 4c than the other phases corresponding to over 20 atomic %, and hence is consistent with chromium carbide.
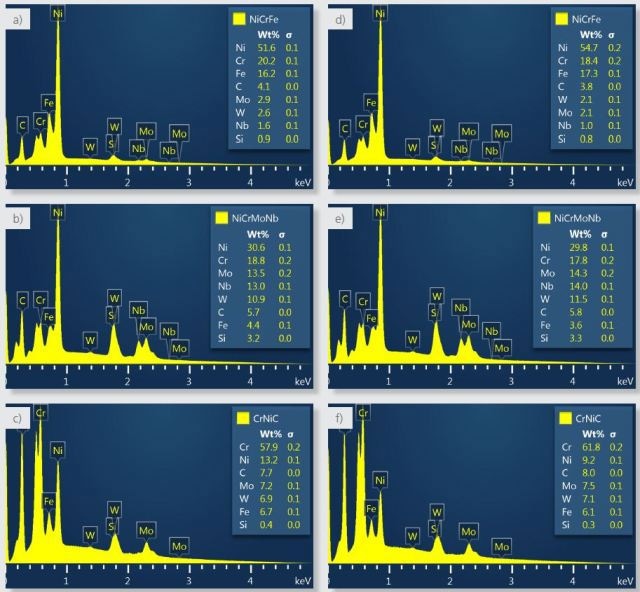
Figure 4. Spectra and composition calculated for the three phases using the default settings (a-c) and with the settings changed to reject boundary pixels that have significant X-ray contributions from more than one phase (d-f).
Testing Accuracy of the Phase Composition of Nano-Precipitates
Figure 5 shows that data is collected at a spatial resolution less than the volume of interaction from which X-rays are being generated in this sample, which is more than 100nm and can approach 200nm. The smallest precipitates measure around 100 to 50nm.
AutoPhaseMap is provided with advanced functions that permit a comprehensive study of nanomaterials where spatial resolution of X-ray generation is a potential issue. Using default settings, software has pixels with contribution from more than one phase to offer the best possible picture of the distribution of phases in the sample.
It is possible to change these settings to reject the pixels near the boundaries, for collecting only the information from single phases and to produce more chemical, spectral and compositional information for the phases. Figure 3b shows an alternative AutoPhaseMap with rejected boundaries. The fraction of each phase in Figure 3d shows reduced area for each phase due to these rejected pixels.
Figure 4 shows a comparison of spectra and composition between the two results where a, b and c are from the default result and d, e and f are from the boundary-corrected result.
It is seen while comparing the results that:
- There is no change in the constituent elements identified in the two results.
- NiCrFe has more nickel and iron and less constituents from the NiCrMoNb (e.g. molybdenum and niobium) and from the CrNiC (chromium).
- NiCrMoNb has slightly more of the hardening elements (molybdenum, niobium and tungsten).
- CrNiC has more chromium and carbon and less nickel.
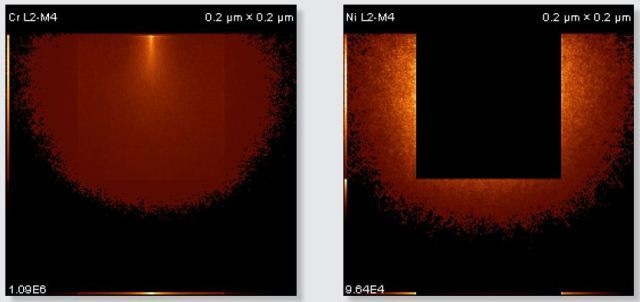
Figure 5. Monte Carlo simulations calculated using NIST Monte for a 100 nm square-shaped chromium carbide precipitate in a nickel/chromium/iron matrix, where a 5 kV electron beam is analyzing the centre of the precipitate. a) region from which Cr L X-rays are emitted. b) region from which Ni L X-rays are emitted. No NiL X-rays are emitted from the chromium carbide because nickel is only present in the matrix for this simulation.
In Figure 6, the compositions calculated for the phases from the two AutoPhaseMap results are compared to spectra reconstructed from pixels away from the boundaries and in the largest precipitates possible.
The results show that the matrix phase NiCrFe does not contain any appreciable niobium or molybdenum and the small amounts of these elements are because of interaction volume effects.
It is observed that the NiCrMoNb, has a slightly different composition determined from the reconstructed phase, suggesting that additional nickel, chromium, and iron is present in the AutoPhaseMap spectra. The CrNiC phase results.
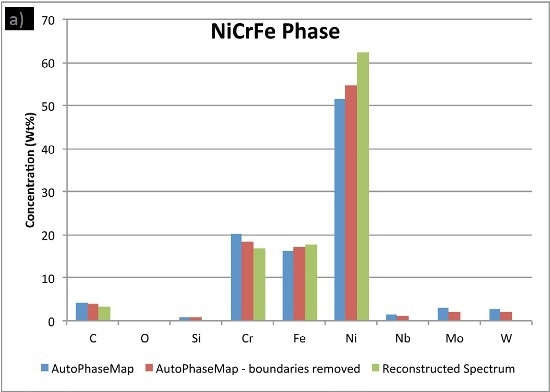
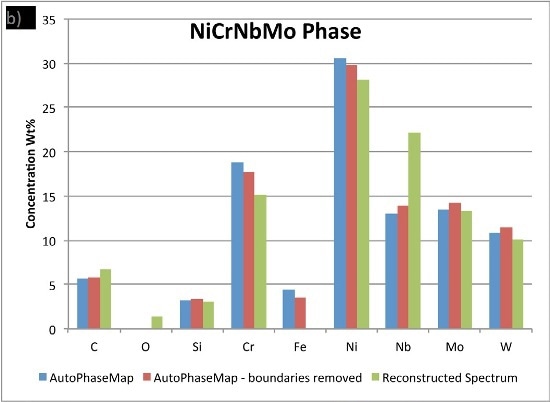
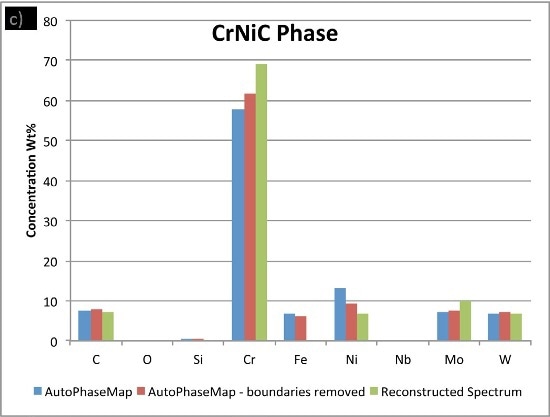
Figure 6. Comparison of compositions calculated for the three phases using a) AutoPhaseMap with default settings b) AutoPhaseMap with boundaries rejected and c) reconstructed spectra from the 'center' of large precipitates.
Conclusion
AutoPhaseMap is an excellent tool to investigate the distribution and composition of nanoscale precipitates in materials. The AutoPhaseMap result indicates spatial information and chemical constituents.
It is also possible to use AutoPhaseMap to check for issues with interaction volume on sub 250nm areas in 5kV data. It is important to check for X-ray signal mixing between phases and this has been shown to be comparatively small in this example.

This information has been sourced, reviewed and adapted from materials provided by Oxford Instruments Nanoanalysis.
For more information on this source, please visit Oxford Instruments Nanoanalysis.