Carbon nanotubes (CNTs) are known to have unique optical properties, excellent strength, and readily tunable electrical and thermal behaviour. As a result they are widely used commercial products with 75% of CNT applications being currently developed in the composites, energy, and electronics industries. CNTs also hold immense potential in the development of future consumer and medical products.
It has been projected that by 2014 government nanotechnology funding will grow as much as $1.0 billion per annum in at least five countries and will account for over $12 billion across the globe. In 2011 approximately $300 million was obtained as revenues from the study of CNTs and by 2016 a 50% increase in manufacturing volume is anticipated.
CNTs are widely produced as multi-wall nanotubes (MWNTs), which contain many layers of graphene cylinders, as they are cheaper to produce than their single-wall counterparts (SWNTs). However, in applications that require a defect-free, well-defined system SWNTs are often preferred because of their unique mechanical and electronic properties.
With an increasingly growing trend towards compact electronics, the demand for SWNTs is expected to increase encouraging the development of low-cost manufacturing and purification techniques.
With the increasing use of CNTs in commercial and research applications, there is a need for new analytical methods to achieve rapid characterization of these nanomaterials. In order to understand the conductive properties of CNTs it is important to determine the nanotube structure, characterized by their chiral index (x, y). Similarly, both the diameter and length of nanotube structures are critical in predicting their behavior in commercial uses.
Since existing methods fail to give all of the required data on a SWNT in one measurement, hybrid techniques are required. Raman spectroscopy combined with dynamic light scattering (DLS) provides an effective way to obtain all of the structural data needed to define a SWNT.
The frequency of the radial breathing mode (vRBM, determined by Raman spectroscopy) can be used to determine the chirality and therefore the diameter of SWNT. The RBM band position is vulnerable to any changes that occur in the nanotube’s bonding structure and chirality. And therefore Raman spectroscopy can be used to measure the diameter and chirality of the SWNTs.
DLS has seen widespread use as a technique for characterizing the hydrodynamic radius of nanoscale materials in suspension. Brownian motion of particles results in
fluctuations of the intensity of scattered light, the time scale of which is related to the particle size. Although DLS assumes a spherical particle, corrections can be made to compensate for the high aspect ratio of nanotubes. An effective length can thereby be extracted from the results, which when coupled with an analysis of the RBM band, allows the accurate determination of nanotube length.
Materials and Methods
Malvern Panalytical’ Helix system was utilized to sequentially extract Raman (structural data) and DLS (nanoscale particle size) data on a single sample. The Helix employs a proprietary non-invasive backscatter (NIBS) detector equipped with electrophoretic (ELS), static (SLS) and dynamic (DLS) light scattering to determine the particles’ hydrodynamic radius from 0.15nm to 5µm.
Using 785 nm excitation from 150 to 1925 cm-1 at 4 cm-1 resolution Raman spectra were obtained. Next SWNT samples comprising a mixture of chiralities were formulated. This was done by tip-sonicating 2mg of SWNT powder in a 10 mL solution of 1% w/v acetic acid and 0.2% w/w chitosan in Nanopure DI water to create a stable dispersion containing separate nanotubes complexed with chitosan.
Sample aliquots of about 50µL were placed into a cuvette with thin quartz windows and then mounted in a temperature controlled compartment for data acquisition at 25°C.
Results and Discussion
A nanotube sample can be analyzed in detail using Raman spectroscopy. A typical spectrum of nanotubes includes the following modes:
- D mode (~1300 cm-1)
- Radial breathing mode (100 - 350 cm-1)
- G mode (~1600 cm-1)
The first mode indicates the structural defects that can be induced by C(sp3)-C(sp3) bonds, whereas the third mode is relative to the vibrations of the C(sp2)-C(sp2) bonds containing the nanotube. The nanotubes’ quality factor can be determined by applying the following equation:
G stands for the peak of the G-band; D stands for the highest intensity peak of the D-band; and B stands for the least value between the peaks related to D and G-bands. As shown in Figure 1 Q spans from 0 to 1, where 1 represents perfect quality.
It is a good practice to determine Q for an individual batch as a large number of defects will negatively impact the SWNTs’ electrical and mechanical properties.
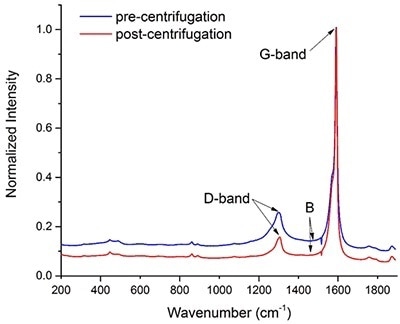
Figure 2. Raman spectra of a batch of carbon nanotubes before (blue) and after purification (red) via centrifugation. The intensity of the two spectra was normalized with respect to the maximum height of their G-bands.
In order to describe the ability of raman spectroscopy to assess quality a commercially available batch of SWNTs comprising a number of chiralities were mixed in a chitosan solution and centrifuged at 21000 x g.
Defective nanotubes will sediment during centrifugation as they are more likely to aggregate. Figure 1 demonstrates that it is possible to track the change in quality of a SWNT sample.
In accordance with Equation 1, the Q factor for the commercial batch before and after centrifugation is 0.87 and 0.92, respectively. This rise in the Q factor indicates that following centrifugation, it is possible to remove some of the defective nanotubes, and the data thus obtained suggests that raman spectroscopy can be applied to assess the quality of a SWNT batch.
The Raman spectrum’s radial breathing mode (RBM) region can reveal the chiralities, and thus, the diameters of different species existing in a nanotube mixture. A SWNT’s diameter (d) can be represented in nanometers as a function of the RBM frequency (ν) in cm-1 (Equation 2):
The SWNT’s diameter can also be expressed as a function of the chirality indices (x, y):
When Equations 2 and 3 are combined, Equation 4 is obtained that corresponds directly with the RBM frequency of the raman spectrum to the chirality of the SWNT.
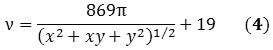
Based on above equations, it is possible to assess the relative purity of a particular batch of SWNTs by detecting the preferred peak with respect to the adjacent ones. Using Equation 4 the frequency of the preferred peak is established by applying the known indices of the SWNT. For instance, the raman spectra of two commercially available batches of (6,5) and (7,6) reveal that other chiralities are present in the RBM region (Figure 2).
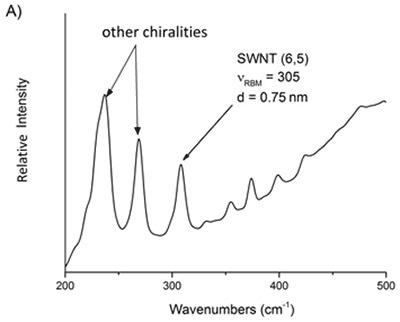
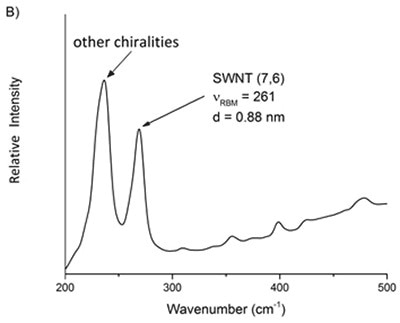
Figure 6. Raman spectra of two commercial samples advertised as primarily A) 6,5 and B) 7,6. From these mixtures, the relative purity of a desired chirality can be ascertained.
The information obtained from the DLS method provides the size distribution as a bulk average of the particles diffusing in solution. This data assumes a spherical particle with an aspect ratio of 1, but owing to its cylindrical structure, a nanotube exhibits an aspect ratio of roughly 1000. However, DLS can be used to measure its hydrodynamic diameter, and can be validated hypothetically using Equations 5 and 6 that describe the diffusion coefficients:
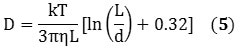
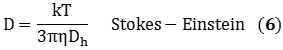
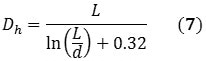
k represents the Boltzmann constant; D represents the diffusion coefficient; T stands for temperature, Dh is the hydrodynamic diameter; η is the viscosity; and L and d represents the length and diameter of the nanotube respectively. Combining Equations 5 and 6 relates Dh to the nanotube’s dimensions in the form of Equation 7:
Malvern Panalytical’s Helix system, which combines raman spectroscopy and DLS measurements makes it possible to obtain both the length and diameter data from an individual batch of SWNTs.
Applying Equation 6, the theoretical hydrodynamic diameter of (6,5) nanotubes with a length of 700 nm and a radial diameter of 0.75 nm is 100 nm. This theoretical hydrodynamic diameter correlates well with the hydrodynamic diameter acquired via the combined DLS measurement (Figure 3).
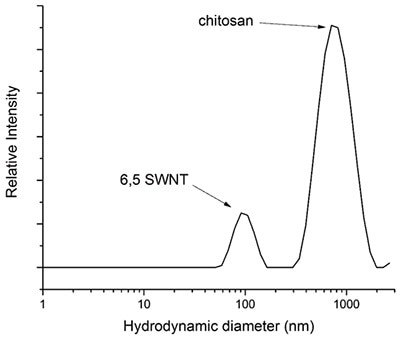
Figure 10. Graph depicting a DLS measurement of a suspension of (6,5)-SWNT dispersed in 0.2% w/w chitosan in water. The DLS measurement was graphed as an average of 14 runs and chitosan has a molecular weight ranging from 190 - 310 kDa.
In the event the nanotube’s length is not known utilizing the diameter from the raman spectroscopy and the quantified hydrodynamic diameter from DLS in the same equation, it is estimated to be 720 nm which correlates well with the value of greater than 700-nm provided by Sigma-Aldrich.
Since the high aspect ratio is present in SWNTs, even the smallest error in the DLS measurement of the hydrodynamic diameter can result in significant changes in the measured length. Hence, the measured length must be taken as an approximated value.
Conclusion
Using an analytical instrument that couples dynamic light scattering (DLS) and Raman spectroscopy into a single platform provides a convenient tool for probing the size, structural properties and quality of SWNTs. It is a convenient and powerful tool for the analysis of commercial batches of carbon nanotubes as well as a means for the characterization of material generated from new manufacturing processes. Additionally, the capabilities of this instrument will be of significant value for the study of many other types of nanomaterials and biopharmaceuticals and these topics will be the subject of future application notes.

This information has been sourced, reviewed and adapted from materials provided by Malvern Panalytical.
For more information please visit Malvern Panalytical.