Graphene is a 2D form of carbon arranged in one-atom thick layers. Carbon atoms in graphene are tightly packed in a regular hexagonal pattern. Mathematically, it can be treated as an substantially large aromatic molecule and thus can produce some novel electronic effects due to this electronic and unique physical structure.
Image Credits: shutterstock.com/Orange Deer
Its novel physical characteristics provide graphene with the potential to form the basis for a number of new applications and devices.
Optical spectroscopy is a robust tool for the non-destructive analysis of devices and their elementary properties. Microspectroscopy is particularly useful in that these instruments are used to examine microscopic sample areas and understand their optical properties. CRAIC Technologies has formulated many different techniques that can be integrated on a single microspectrometer and used in the research of graphene and other carbon-based structures.
Transmission microspectroscopy in the UV-VIS-NIR region is a method that has been established to be very useful for the identification and characterization of graphene and graphene-based molecules. One reason for this is that graphene oxides display an absorption peak at 230 nm related to the p-p* transition of the aromatic C-C bond and a shoulder at 300 nm that is caused by n-p* transitions of the C=O bond, making the deep UV spectra highly vital for identifying oxidation.

Figure 1. The 2030PV PRO™ UV-VIS-NIR microspectrophotometer from CRAIC Technologies. This instrument can be configured for transmission, reflectance, photoluminescence, and Raman spectroscopy and imaging.
Another reason is for the capability to easily and non-destructively measure the number of layers in the sample. In the VIS-NIR regions, pristine graphene absorbs ~2.29% per layer of graphene3. As illustrated in Figure 2, the transmission spectra obtained from graphene samples with increasing layers demonstrates this property. From these spectra, the thicknesses of the samples match 1, 2, 4, and 6 layers of graphene at the sampled locations.
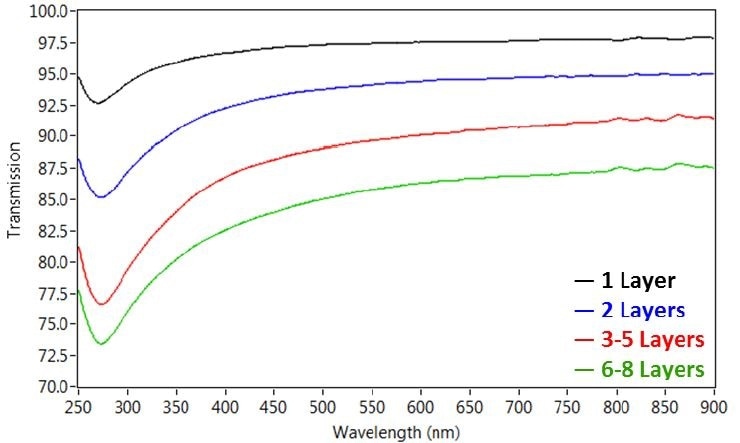
Figure 2. Transmission microspectra™ of single, dual, and multi-layered graphene samples acquired with the 2030PV PRO™ microspectrophotometer, illustrating the change in transmission spectra in the deep UV region corresponding with an increase in graphene layers.
As the number of layers increases, interference patterns become obvious and standard film thickness measurement procedures may be used.
Such interference spectra are revealed in Figure 3. By joining the optical constants of graphene with the Fresnel equations, the algorithms in CRAIC FilmPro™ software can be used in order to compute the thickness of these graphene films as well.
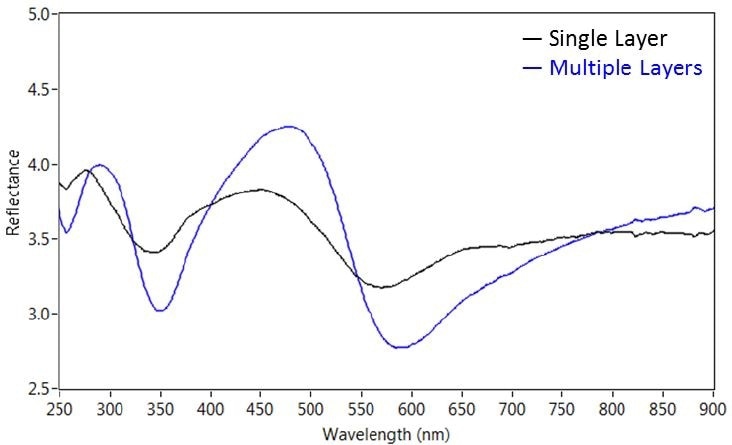
Figure 3. Absolute reflectance microspectra of single and multiple layer graphene acquired with the 2030PV PRO™ microspectrophotometer illustrating the change in interference peaks due to sample thickness.
Raman Microspectroscopy
Raman microspectroscopy is another very useful spectroscopic instrument, because the vibrational spectra attained can be used to identify molecular bonds and spot differences in local environments. This is because the bonds created between atoms have specific vibrational frequencies that match each atom's mass and the strength of the bond between the atoms.
Complex molecules thus display many peaks and can be readily identified by the pattern or "fingerprint" formed by those peaks. This is particularly useful for 1 and 2D materials because the sampling area is restricted by the size of the laser spot, and it can detect differences in local environments.
In graphene based materials, there are three typical peaks that are characteristically observed in the Raman spectra, as presented in Figure 4. Specifically, these are known as the D-peak at 1360 cm-1, G-peak at 1600 cm-1 and 2D peak at 2700 cm-1. The G-peak is because of the carbon-carbon bond stretching, while the D-peak indicates disorder or impurities in the Graphene sample.
The 2D peak is common to all graphite samples, and the width, intensity and location of this peak can be used so as to define the number of layers of the sample. The existence of the D peak in this spectrum represents disorder in the sample and the intensity of this peak can be used to measure the disorder in the sample. The exact frequency of these vibrations will be impacted by the local environment, such as solvents, substrate and localized defects.
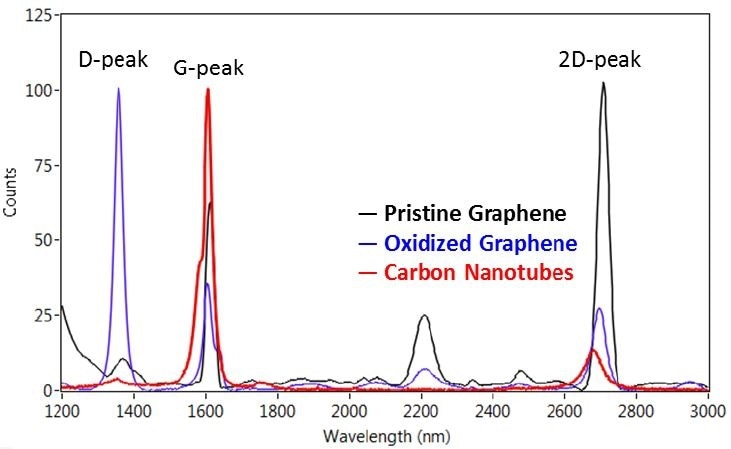
Figure 4. Raman spectra of graphene and carbon nanotube samples. The D, G, and 2D peaks are clearly visible in all three samples. The additional band observed at ~2205 cm-1 is due to the substrate that the graphene samples were mounted on.
Microspectroscopy
CRAIC designs and builds UV-visible-NIR range microspectrometers for a number of different applications. They integrate many different spectroscopic methods into one instrument that is capable of measuring the spectra of micron-scale sample areas.
A microspectrophotometer is configured for transmission microspectroscopy and shown as an optical diagram in Figure 5. The light is focused onto a sample, in this case the graphene and the transmitted light is gathered and imaged onto the entrance aperture of the spectrophotometer. Since the entrance aperture is mirrored, an image is also the entrance aperture superimposed over the sample measurement area. This makes for quick and simple alignment.
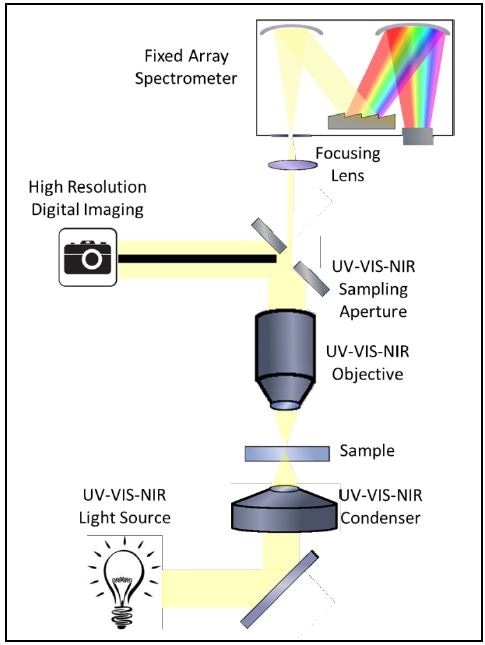
Figure 5. Optical diagram of a microspectrophotometer configured for UV-VIS-NIR transmission microspectra™.
With Raman microspectroscopy, the optical diagram is marginally different because of the nature of these types of experiments. Figure 6 is an optical diagram of a microspectrometer configured for Raman microspectroscopy.
The laser is aimed at a sample, in this case the graphene, by incident illumination. The Raman scattered light is gathered and imaged onto the entrance aperture of the spectrophotometer. A Raman microspectra™ is then gathered.
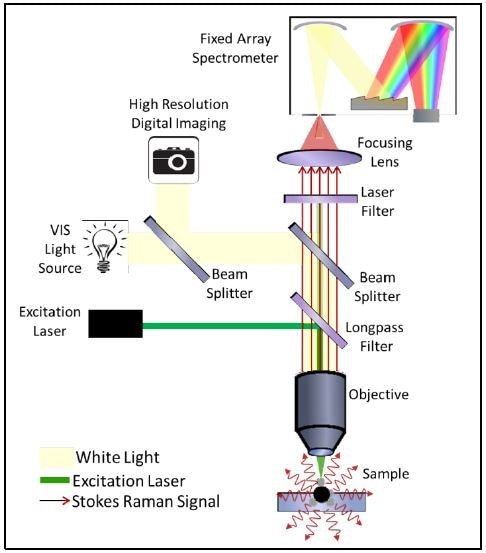
Figure 6. Optical diagram of a microspectrometer configured for Raman microspectra™.
The microspectrometer also has capabilities for NIR and UV imaging, besides the standard color imaging, and it can be configured for photoluminescence, reflectance, polarization microspectroscopy, kinetic spectroscopy, small spot thin film thickness measurements and 5D spectral surface mapping.
References
1. Graphene image By AlexanderAIUS - Own work, License CC BY-SA 3.0, https://en.wikipedia.org/wiki/Graphene#/media/File:Graphen.ipg
2. Mak, K.F., Solid State Communications, 152, 1341-1349 (2012).
3. Bonaccorso, F. Nature Photonics, 4, 611 - 622 (2010).

This information has been sourced, reviewed and adapted from materials provided by CRAIC Technologies.
For more information on this source, please visit CRAIC Technologies.