In semiconductor manufacturing, a process called chemical mechanical planarization (CMP) is used for polishing wafer surfaces. CMP uses a slurry that contains both functional chemicals and nanoparticles. Cerium dioxide (CeO2) particles are normally used in CMP slurries, and the sizes of the particles in the slurry play a major role. Particles in the working (or average) size range eliminates the target material, but larger particles beyond the working size range can gouge or scratch the surface of the wafer, leading to mechanical damage which limits the yield of semiconductor development.
While it only takes a small number of larger particles to cause damage, it is very critical to characterize CMP abrasive raw materials and slurry mixtures before use to determine the large particle concentration or count (LPC). LPC results can be employed to compare why certain slurry samples cause more defects than others and which abrasive raw material lots are more suitable for CMP use. For abrasive manufacturing, this level of detail on the particle size distribution is also important and hence, processes that reduce LPCs can be optimized and refinement techniques to eliminate LPCs can be accurately compared.
The quest for robust techniques for LPC determination is driven by the aim to ensure product quality. One of the difficulties faced in nanoparticle metrology is being able to locate and measure these larger particles that are present in small numbers relative to the large number of particles in the working range.
Conventional particle analysis metrology that employs light scattering or laser diffraction to characterize size distributions cannot easily detect small concentrations of particles beyond the size range of the majority. This is because, their relatively small signal is drowned out by the larger signal. Consequently, these methods are directed toward detection of an average size instead of analyzing individual outlier particles. Thus, they are not always effective in locating the few defect-causing, larger particles in CMP slurries.
Further limitations to laser/light-based particle sizing techniques are that they are bulk property measurements which are incapable of distinguishing between particle types. In addition, they may be affected by other components in the slurry that may also scatter light, such as surfactants and polymers. Light-scattering-based particle sizing techniques produce results that generally represent the size of hydrodynamic particles, which is bigger than the actual solid particle size and may be affected by changes in dilution techniques during sample preparation or by organic components on the particle surface.
These limitations are addressed by single particle ICP-MS (SP-ICP-MS), a method which can determine low concentrations of particles much faster than conventional particle analysis techniques.1, 2 Additionally, the SP-ICP-MS technique is selective to specified metallic particle types, so size results are not influenced by chemical components in the slurry or particles of other elemental composition. Preliminary studies have demonstrated that SP-ICP-MS is highly effective in CMP slurry analysis;3 this work builds upon the initial studies by exploring its use to measure LPCs besides the mean particle size (MPS).
Experiment
Samples and Sample Preparation
First, three lots of ceria-based CMP slurries were measured. The sample was prepared by sonicating and diluting the slurries with deionized water until particle concentrations were about 100,000 particles/mL (part/mL). Diluted samples were sonicated again before analysis.
Instrumentation and Measurement
PerkinElmer NexION® ICP-MS was used to make all measurements. Data collection and processing was done using Syngistix™ Nano Application Software Module. Table 1 shows the method parameters and instrumental conditions. The transport efficiency was established by aspirating 60 nm gold nanoparticles at a concentration of 100,000 particles/mL, while dissolved calibrations were performed with 1, 2, and 3 µg/L cerium (Ce) standards.
As ICP-MS detects only Ce (rather than the whole CeO2 particle), the density of CeO2 and the mass fraction of Ce (81.40%) should be entered in the Nano Application Module for correct calculation of particle size.
Table 1. NexION ICP-MS Instrumentation and Method Conditions.
| Parameter |
Value |
| Sample Uptake |
348 µL/min |
| Nebulizer |
Glass concentric |
| Spray Chamber |
Glass cyclonic |
| Nebulizer Flow |
Optimized for maximum sensitivity |
| RF Power |
1600 W |
| Analyte |
Ce 140 |
| Density |
7.65 g/cm3 |
| Mass Fraction |
81.40% |
| Analysis Mode |
Standard |
| Dwell Time |
50 µs |
| Analysis Time |
120 sec |
| Transport Efficiency |
7.29% |
Results and Discussion
Figure 1 shows a classic size distribution histogram of a CMP slurry (monitoring Ce+). It was observed that the plot displayed a fairly broad particle size distribution with peaks at 30, 40 and 50 nm out of which the most frequent size is 20 nm. Although particles were detected, those larger than 60 nm were not shown in this figure. This type of information makes it possible to determine the distribution and size of the particles present, and also the concentration of each particle size or in a specific range.
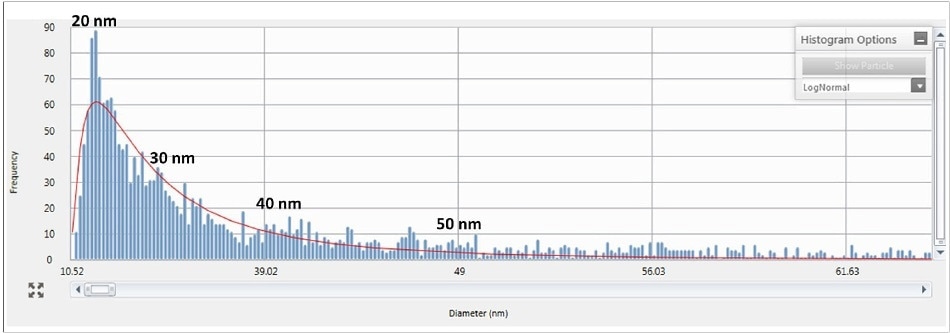
Figure 1. Histogram showing particle size distribution of a typical CMP slurry.
Table 2 shows the particle size and concentration for three lots of ceria-based CMP slurries. These results demonstrate that Sample 1 has a mean particle size (MPS) 10 nm (20%) larger than Sample 2 and Sample 3. Particle concentrations can also be determined for specific size fractions of interest, because SP-ICP-MS can count individual particles. By counting particles above a specific threshold, the LPC can be easily determined. In these slurry samples, particles greater than 100 nm and 150 nm have been chosen to represent the LPC threshold.
Table 2. Particle Size and Concentrations for three CMP Slurries.
| Sample |
Particle Sizing |
Particle Counting |
| MPS (nm) |
% RSD |
Total Particles Counted |
Particles > 100 nm |
% of Particles >100 nm |
Particles >150 nm |
% of Particles >150 nm |
| 1 |
52.6 |
2 |
3279 |
387 |
11.8 |
49 |
1.5 |
| 2 |
42.1 |
1 |
2136 |
148 |
6.9 |
14 |
0.7 |
| 3 |
42.2 |
1 |
2005 |
148 |
7.4 |
14 |
0.7 |
Together with the change in MPS, Sample 1 was also found to have a higher LPC at the 100 nm cutoff by about 40%, and twice as many particles at the 150 nm cutoff. The potential to rapidly determine particle size in CMP slurries is very important so that samples can be screened before use. Here, Sample 1 obviously has a higher concentration of larger particles when compared to Sample 2 and Sample 3 and may cause a higher level of scratch defects during CMP processes.
Conclusion
The capability of SP-ICP-MS to quickly determine CeO2 particle sizes and concentrations in CMP slurry mixtures has been clearly shown in this article. Counts at specific size thresholds allows an innovative way of measuring large particles at the tail end of the particle-size distribution. This information permits CMP Slurry Developers to foresee performance differences in their slurries prior to use.
References
- Stephan, C., Neubauer, K. “Single Particle Inductively Coupled Plasma Mass Spectrometry: Understanding How and Why”, PerkinElmer white paper, 2014.
- Hineman, A., Stephan, C. JAAS, 2014, 29, p. 1252.
- Davidowski, L., Stephan, C. “The Characterization of Nanoparticle Element Oxide Slurries Used in Chemical- Mechanical Planarization by Single Particle ICP-MS”, PerkinElmer application note, 2014.

This information has been sourced, reviewed and adapted from materials provided by PerkinElmer Inc.
For more information on this source, please visit PerkinElmer Inc.