With the advent of nanotechnology, a wide range of nanomaterials are increasingly being used in many different products. Among the most commonly used nanomaterials are carbon nanotubes (CNTs), which are being produced at several thousand tons per year1. During the production process of these materials, metallic catalysts are often used which can result in metal NPs remaining on the CNTs, as shown in Figure 1.
However, remnants are always present even though finished CNTs are washed to eliminate as much of the residual catalysts as possible. Since the CNTs performance is affected by residual metals, it is vital to establish the level of metallic residue left from the catalysts. In addition, the metal impurities can be employed as a tracer for CNTs in fate and effect studies, thus overcoming the challenges of measuring carbon in complex biological and environmental media.
It is difficult to measure the amount of metals present in CNTs. High levels can be directly measured in the solid by a number of techniques, including TEM and XRF, while low-level analysis needs complete digestion of the sample before analysis by ICP-MS or ICP-OES. The major drawback of XRF is that it measures the total quantity of metal in the sample instead of measuring the metal-associated with individual CNTs. While TEM is capable of measuring individual CNTs and their associated metal NPs, it is a laborious and slow process. Classic TEM analysis deals with finding a particle/area to measure, conducting the measurement, and then repeating the measurement an adequate number of times to achieve a representative result. Consequently, usually only a small number of samples of CNTs can be measured in 24 hours.
A major restriction of traditional ICP-MS and ICP-OES analysis is that they need complete digestion of the CNTs, which is difficult due to their chemical inertness. Digestion processes involve dangerous acids, small sample quantities and long processing and digestion times, which even with closed-vessel microwave digestion, can extend from hours to days. While a leaching procedure would be quicker, this would only eliminate metals that remain on the surface and not those embedded in the CNTs and hence, do not provide a complete analysis.
Single particle ICP-MS (SP-ICP-MS) is another option available for determining the residual metal content in CNTs. With this method, solid nanoparticles (including CNTs) are fully ionized, and the resulting metallic signal related to each individual CNT or CNT bundle is measured2. By observing the transient metallic signals, a semi-quantitative measurement of the amount of metal can be established without the necessity for sample digestion. SP-ICP-MS allows measurement at lower concentration levels than by TEM or EDX. The technique also allows quick measurement of thousands of individual CNTs in a minute, which results in the estimation of particle number concentrations.
This article focuses on the determination of yttrium (Y), a frequently used catalyst, in single wall CNTs (SWCNTs).
Experiment
Samples and Standards
Carbon Solutions (Riverside, CA) supplied the SWCNTs in powder form. To prepare stock solutions, a known quantity of SWCNTs was suspended in a known volume of deionized (18.2 MΩ-cm) water containing 1% (w/w) sodium deoxycholate. Next, the CNTs were suspended in solution by sonicating overnight and then further diluted 100 to 1000x. The solutions were bath sonicated for 15-20 minutes prior to analysis.
The transport efficiency of the system was determined by diluting 60 nm Gold NPs (SRM 8013, NIST, Gaithersburg, MD) with deionized water and brought to a final concentration of 1 µg/L. Dissolved gold standards were used to determine transport efficiency using the mass-based approach3. Then, using a 1000 mg/L stock solution, aqueous yttrium (Y) calibration standards were prepared at 1, 2, and 5 µg/L.
To find out if the small (20 nm) Y particles were related to larger SWCNTs, CNT suspensions were filtered via 0.02 µm, 0.2 µm, and 2 µm filters (Whatman, Pittsburgh, PA; Millex, Billerica, MA). In order to validate the complete ionization of the SWCNTs, a nitric acid digested SWCNT sample was examined at the same dilution as the intact SWCNT solutions.
Instrumentation
All SP-ICP-MS analyses were carried out on a NexION® ICP-MS (PerkinElmer, Shelton, CT) using the conditions shown in Table 1. Then, using the Syngistix™ Nano Application Module, data acquisition and analysis were performed.
Table 1. NexION Operating Conditions.
| Instrument Parameter |
Value |
| Nebulizer |
Glass Concentric |
| Spray Chamber |
Baffled Glass Cyclonic |
| Nebulizer Gas Flow (L/min) |
0.85-1.00 |
| Sample Uptake Rate (mL/min) |
0.300 |
| ICP RF Power (W) |
1600 |
Results and Discussion
Transmission electron microscopy (TEM) was used to carry out initial studies. TEM was used to determine the extent of association of Y with the CNTs. Shown in Figure 1 are TEM images of CNTs, which appear as long, grey rods. The dark areas seen within the CNTs are metals (Ni, Y), as verified with TEM. The CNT supplier also affirms that Y and Ni are used as catalysts in its production, thus providing further confirmation of their presence.
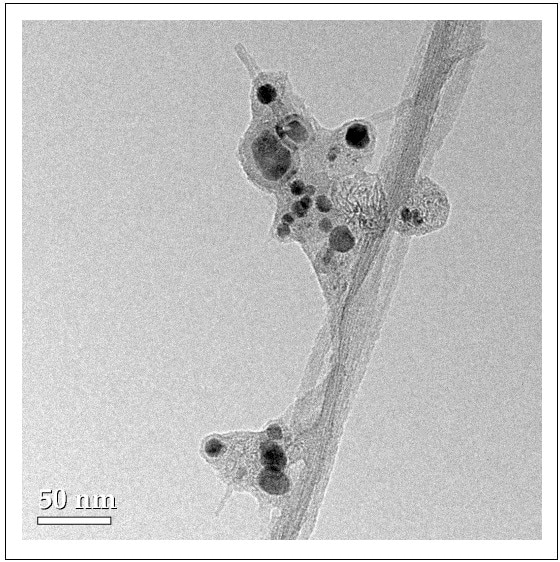
Figure 1. Transmission electron microscopy (TEM) images of CNTs showing electron dense metal NPs associated with amorphous graphitic material and long SWCNTs (Wang et al., 2016).
The SP-ICP-MS signals for Y, where each spike represents the Y signal from a SWCNT, are shown in Figure 2. The signals from the 2 µm filtered as well as unfiltered samples look very similar, suggesting that the CNTs mostly pass through the 2 µm pores. These results are found to be consistent with the reported physical dimensions of the SWCNTs: lengths of 1800 + 1000 nm and diameters of 3.8 + 1.8 nm. Yet, with a smaller pore size of 0.2 µm, majority of the CNTs were removed, as shown by the reduced number of Y pulses. Also, with a pore size of 0.02 µm, there were no Y signals, signifying that none of the CNTs have passed through the filter. This study shows that Y NPs are indeed associated with the CNTs: Y signal is seen when the CNTs are present, but the Y signal disappears when the CNTs are removed.
The Syngisitx Nano Application Module can automatically count the number of peaks found in an analysis and shows the median and average intensities of both the Y-generated and background pulses. The total amount of metal present in the SWCNTs is provided by signal integration. With knowledge about analyte density, the Syngisitx Nano Application Module can convert each pulse into an equivalent spherical diameter. Multiple metallic aggregates, however, may be attached to each of the SWCNTs as shown in Figure 1. Thus, the reported diameter may be larger than the actual diameter of an individual metal NP. The number concentration of the SWCNTs in solution can also be computed using the transport efficiency.
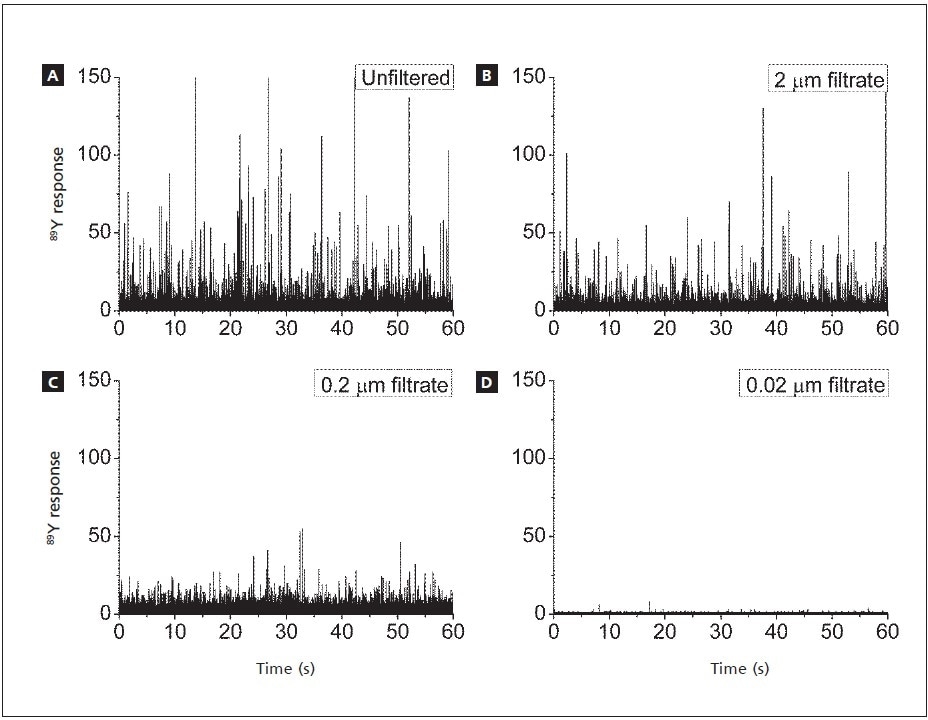
Figure 2. SP-ICP-MS signals for Y associated with CNTs. a) unfiltered; filtered through b) 2 µm pores; c) 0.2 µm pores; d) 0.02 µm pores (Wang, et al, 2016).
Solutions containing 43.5 µg/L SWCNT were prepared in this study. One of these solutions was directly analyzed by SP-ICP-MS, and the other one was acid digested. Figures 3a (digested) and 3b (undigested suspension) show the resulting SP-ICP-MS signals. While the absence of peaks from the digestion shows that all CNTs were dissolved, the presence of many peaks in Figure 3b shows that numerous Y-containing NPs are being identified. The digested solution yielded a Y concentration of 2.18 µg/L, while the SP-ICP-MS analysis produced a Y concentration of 2.15 µg/L, confirming the accuracy of the SP-ICP-MS results for undigested suspensions. These results also show that about 5% Y are present in the CNTs.
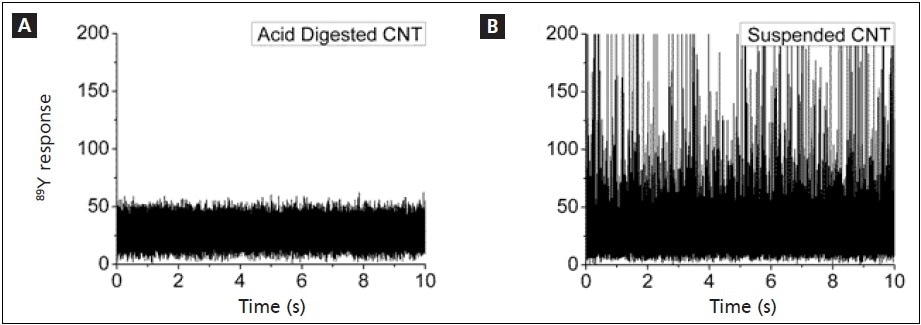
Figure 3. Analysis of Y in a.) acid digested, and b.) undigested 43.5 µg/L CNT solutions.
Summary
This article shows how the metal-content of SWCNTs can be effectively quantified by the SP-ICP-MS method. The use of metal impurities makes it possible to determine SWCNT number concentrations, with potential applications to complex media. In addition, if metal content is known, concentrations of SWCNT in unknown samples can be easily established. The impact of this work is that metallic contaminants in CNTs can be accurately measured without the need to digest the CNTs which is a long and challenging process.
References
- De Volder, M.F.L., et al., Carbon Nanotubes: Present and Future Commercial Applications. Science, 2013. 339(6119): p. 5.
- Reed, R.B., et al., Detection of single walled carbon nanotubes by monitoring embedded metals. Environmental Science: Processes & Impacts, 2013. 15(1): p. 204.
- Pace, H.E., et al., Determining Transport Efficiency for the Purpose of Counting and Sizing Nanoparticles via Single Particle Inductively Coupled Plasma Mass Spectrometry. Analytical Chemistry, 2011. 83(24): p. 9.
- Jingjing Wang, Ronald S. Lankone, Robert B. Reed, D. Howard Fairbrother, James F. Ranville, Analysis of single-walled carbon nanotubes using spICP-MS with microsecond dwell time, NanoImpact, Volume 1, January 2016, Pages 65-72, ISSN 2452-0748.

This information has been sourced, reviewed and adapted from materials provided by PerkinElmer Inc.
For more information on this source, please visit PerkinElmer Inc.