Rut Besseling, Raquel Arribas-Bueno, Remy van Tuijn, Ad Gerich, InProcess-LSP The Netherlands
Relevance of Nano-Emulsions
An emulsion is a two-phase system formed by droplets dispersed in another non-miscible liquid. Many emulsions consist of a hydrophobic ‘oily’ phase dispersed in a continuous aqueous phase.
Additionally, most emulsions contain at least one other substance, a surfactant, to stabilize droplets against aggregation and coalescence and to help controlling whether the hydrophobic liquid is dispersed in the aqueous phase, or vice-versa1.
The most common function of emulsions is transport of water-insoluble substances in a stable, finely dispersed form1, which offers many opportunities for designing advanced formulations in pharma, cosmetics and food/nutraceuticals.
Nano-Emulsion Manufacturing
Droplet size and size distribution (PSD) of nano-emulsions have significant impact on their rheological behavior, stability, functionality and safety2. To optimize these properties and control the size for various formulations and manufacturing settings, different manufacturing methods have been devised.
High pressure homogenization (HPH), which we focus on here, dates back to the early 1900’s with Auguste Gaulin’s invention for milk homogenization, and is currently one of several so called ‘high energy’ methods; others include micro-fluidization and sonication3,4 jet dispersing and high amplitude ultrasonication5.
In a typical HPH process, a crude emulsion is first prepared using rotor/stator homogenization and subsequently used as feed in the HPH.
In the HPH it then passes through a small nozzle, Figure 1, at high pressure (up to several kbar) causing high shear, droplet elongation and turbulent fluctuations, together leading to break-up of droplets into smaller ones.
The pressure level, which determines the energy input, is the main process parameter to tune the droplet size characteristics. While significant progress has been made in the mechanistic understanding of HPH size reduction6, important challenges remain for concentrated emulsion7 and complex formulations found in practice7.
Aspects such as ‘overprocessing’, competition between droplet break-up and coalescence and their dependance on e.g. surfactant properties and concentration remain poorly understood.
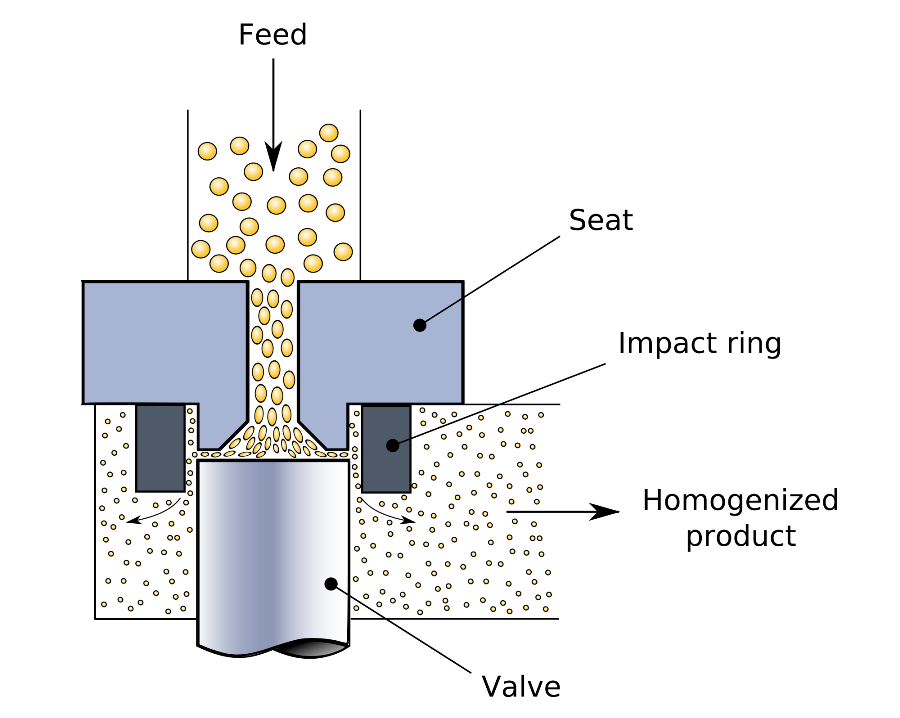
Figure 1. Schematic of the High Pressure Homogenization Process. Image Credit: https://commons.wikimedia.org/wiki/File:Homogenizing_valve.svg
Practically, in many HPH processes, several passes of the emulsion are required to achieve monodisperse droplets (narrow size distribution) and the process is often performed in a circulation loop.
Careful characterization of the droplet size at different time points is therefore required for development purposes or to ensure correct process parameters in scale-up and manufacturing.
However, traditional sizing methods require sampling and dilution steps, which introduces risks of measuring unrepresentative samples, prevents possible process control and requires investment in man-hours.
Representativeness of samples is particularly important for homogenization of unstable (intermediate) emulsions, where off-line characterization can cause unreliable results due to droplet growth, while during process flow, the emulsion may be kinetically stabilized.
This will be illustrated later in this paper. Inline and real-time sizing is therefore the most desired method to monitor emulsification processes.
Process Analytical Technology for Real-Time Particle Size Measurement
The FDA defines Process Analytical Technology (part of ‘Quality by Design’, QbD) as a system to design, analyze and control manufacturing through timely measurements (i.e., during processing) of critical quality and performance attributes of in-process materials and processes.
PAT thus aims to improve process understanding, and ensure constant final product quality, by in/on-line measurement of product characteristics, ideally to provide feedback for process control and guaranteed product quality (‘Quality Attribute based Design Space’).
Besides better product quality and consistency, PAT can also increase first pass yields, reduce waste, minimize batch rejects and reduce production cycling time. PAT is also crucial for continuous manufacturing processes, where real-time process control is essential, and for enabling ‘Realtime Release Testing’ for direct and safe release of products for patients.
While QbD starts to be adopted for nanomedice8, direct inline measurement or control of size characteristics has been lacking, despite the fact that size characteristics are a major quality attribute9.
The Step to Real-Time Size Characterization of Nanoparticles
Spatially Resolved Dynamic Light Scattering as PAT Tool
Size characterization of nano-emulsion processes is currently almost exclusively performed off-line, using e.g. laser-diffraction, analytical centrifugation, or traditional Dynamic Light Scattering (DLS).
For PAT, the disadvantage of these techniques is their off-line character: they require varying degrees of sample preparation, cannot (or hardly) be performed under flow conditions, are limited in speed for real-time measurement, and the measurement geometry does not allow convenient process integration.
Standard DLS is among the most popular off-line tools. It measures fluctuations in scattered laser light due to Brownian diffusion of the droplets; the frequency of these fluctuations reflects the particles diffusion coefficient D which provides the size, d (and size distribution) via the Stokes-Einstein relation, d = KBT/(3πηsD), with ηs the solvent viscosity.
True inline measurements are not possible with various current DLS-schemes: they require (nearly) static conditions to ensure that the measured intensity fluctuations are solely caused by diffusion and not influenced by flow, while they are limited to low turbidity samples to avoid multiple scattering, while relatively high turbidity are often encountered in industrial processes such as homogenization.
To overcome these limitations, InProcess-LSP developed the NanoFlowSizer10, employing innovative ‘Low Coherence Interferometry’ using NIR (1300 nm) broadband light, which enables Spatially Resolved Dynamic Light Scattering (SR-DLS).
Rather than only an average scattering signal, SR-DLS instantaneously resolves scattered light and its fluctuations from different depths in the sample (Figure 2). This data holds information on both steady motion due to flow and Brownian motion.
The contribution due to the latter can be extracted from SR-DLS measurements under suitable flow conditions and used to obtain size characteristics (Figure 3).
Additionally, automatic depth analysis excluding multiple scattered light enables measurement of samples with turbidity levels far exceeding those of most current state of the art DLS (see Figure 4).
Rapid measurements (~10 secs) and inline modules for flows from ~mL/min to over 300 L/hr as well as offline measurements allow versatile applications of the instrument.
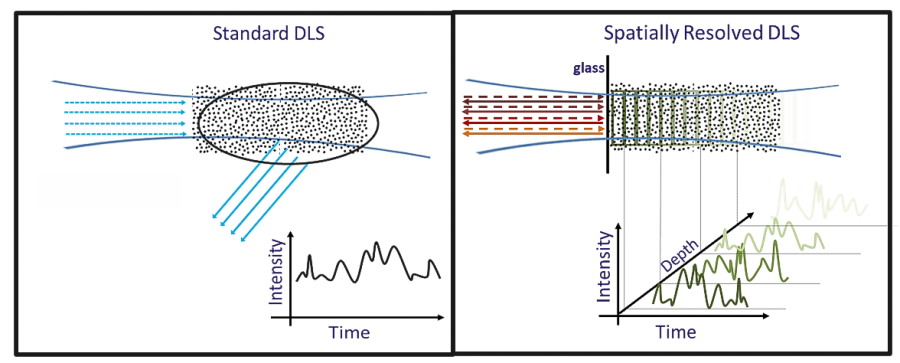
Figure 2. Conventional DLS versus Spatially Resolved-DLS. Left: Standard DLS detects only an average scattering signal Right: SR-DLS detects scattered light fluctuations resolved as function of depth. Image Credit: InProcess-LSP
Process monitoring using the instrument is achieved by integrating the probe unit, which is coupled to dedicated adaptors including a suitable flow cell (from mm-scale up to 2” inner diameter) into the process stream for direct measurement of the emulsion as it is being processed.
Size characterization is thus achieved real-time, during flow, at the full concentration employed in the process. This provides ‘instantaneous’ and continuous information about the changes in droplet size characteristics during the emulsification and at different conditions.
The instrument can be applied from small scale laboratory/pilot scale processes to full scale production pipelines.
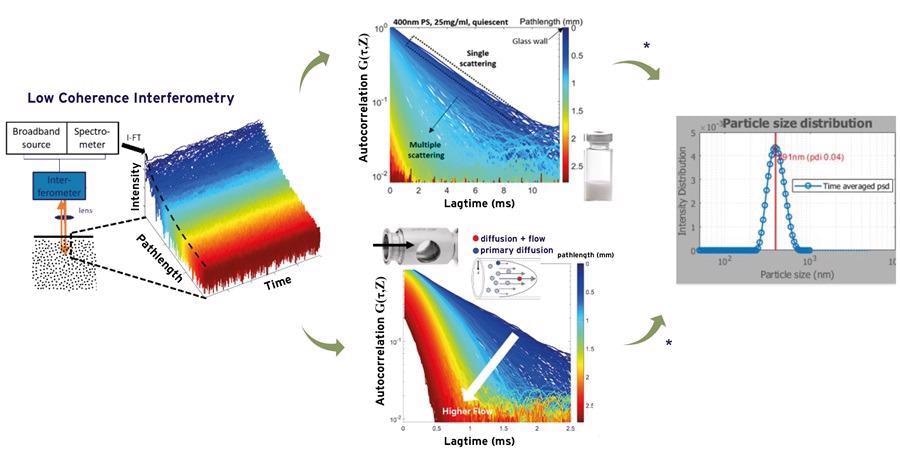
Figure 3. Measured depth resolved intensity fluctuations and the patented analysis methods of the NanoFlowSizer provide particle size characteristics for turbid and flowing suspensions. Upper middle part shows single and multiple scattering regimes; the latter are effectively filtered using the NFS algorithms. Lower middle part shows impact of flow on the correlation functions, from which the Brownian motion component and the flow can be analyzed. Image Credit: InProcess-LSP
Applicable Concentration/Turbidity Ranges
The turbidity range over which the NFS instrument can operate is illustrated in Figure 4 for the case of polystyrene particles. The data points show NFS size measurements at various concentrations, matching the supplier specified size (horizontal dashed lines) for all employed concentrations.
The line indicating the maximum size accessible at each concentration represents a constant turbidity level, the maximum for which sufficient single scattering signal is available to the NFS. It is calculated using Mie theory and ‘hard sphere’ structure effects for polystyrene up to high concentration11.
The dashed line, representing the typical turbidity levels of other DLS techniques, illustrates the extended size/concentration range for the NFS. Note that the shape/extent of the accessible ranges depends on the dispersion optical properties, see Figure 8b.
![Size-concentration regime for polystyrene reference standards using SR-DLS. Lines are calculated using Mie-Percus-Yevick model [11] representing the maximum turbidity accessible for the NFS and other techniques.](https://d1otjdv2bf0507.cloudfront.net/images/Article_Images/ImageForArticle_5679_4427444084557874488.png)
Figure 4. Size-concentration regime for polystyrene reference standards using SR-DLS. Lines are calculated using Mie-Percus-Yevick model11 representing the maximum turbidity accessible for the NFS and other techniques. Image Credit: InProcess-LSP
Interaction Effects in Concentrated Emulsions
While Figure 8 shows that relatively large turbidity samples (large size/and or concentration) can be measured using the NFS, it is well-known that particle diffusion, which is what the NFS measures, can be modified due to ‘crowding’ or other interactions at high volume fractions.
The measured diffusion coefficient may well be employed ‘as such’ for qualitative process monitoring, but for direct quantitative sizing a calibration of the ‘hindering factor’, d/deff (φ) can be established using a dilution of collected samples. Here deff (φ) is the ‘effective’ size measured for a volume fraction φ, and d the actual size, measured in the diluted case (φ < ∼0.01).
Note that a common approach to account for ‘hindered diffusion’ is to use the generalized Stokes Einstein relation d = KBT/(3πηD) where instead of solvent viscosity, the emulsion viscosity is employed. It is known that this approach can be fundamentally flawed and may only apply in specific cases12.
Materials and Methods
Two examples of inline monitoring of two different emulsion systems are described. The first concerns model oil/water (O/W) emulsions prepared at three different oil volume fractions with a maximum of φ = 0.22, each homogenized in a separate run.
The second example employs an unstable pharmaceutical emulsion system consisting of an organic solvent phase dispersed in an aqueous phase (OS/W).
Figure 5 shows schematics of the homogenization circuit for the two cases with the NFS integrated. Both consist of a circulation loop in which emulsion is homogenized continuously using a lab-scale homogenizer.
The temperature rise of the emulsion in the homogenizer was mitigated in both cases using a heat exchanger placed after the HPH. The temperature was monitored using a sensor integrated near the flow cell during the process and used as input for the NFS to calculate the appropriate solvent viscosity.
The droplet size was analyzed by the NFS in real-time during the different homogenization processes with continuous flow in the cell.
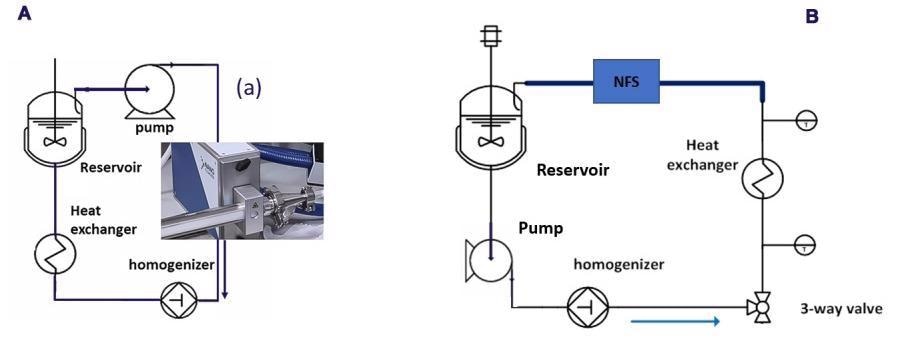
Figure 5. Schematic HPH flow diagram with the NFS integrated as PAT tool for droplet size determination (a) Configuration for the three O/W emulsions runs (b) Configuration for the homogenization of the unstable OS/W emulsion. Image Credit: InProcess-LSP
An important aspect of using the NFS as a PAT tool is the positioning and its integration in the process. Firstly, process/product relevant droplet size information must be obtained, which affects the choice of the position with respect to the HPH.
Secondly, for optimal inline measurement performance, a laminar, fully developed flow without pulsation is required. Since flow directly at the outlet of the HPH was pulsating, two different solutions were employed. For the O/W emulsion runs the NFS was positioned at the HPH inlet, with the benefit that the properties of the emulsion in the reservoir were measured.
For the unstable OS/W homogenization, the instrument was placed after the heat exchanger, which reduced the pulsation sufficiently, and allowed the flow to be stopped to study the emulsion stability.
Real-Time Droplet Size Determination During O/W Emulsion Homogenization
Formulations and Process Description
The three emulsions used in the consecutive runs consisted of purified sunflower oil (Sigma-Aldrich) at volume fractions φ = 0.055, φ = 0.11, and φ = 0.22 (5, 10 and 20 wt%), in tap water with 1 wt% Tween 20. Each crude emulsion was first homogenized at 200bar until a stationary size and polydispersity was reached, after which the pressure was increased in steps of 200 bar, each time when size characteristics become constant, up to 800bar.
The actual set up corresponding to Figure 5a is shown in Figure 6. The NFS was coupled with a ¾” inner diameter flow cell with sight glass and the flowrate through the HPH (Panda 2000, GEA) was approximately 8 L/h. The emulsion flow through the NFS was provided by a stable non-pulsating micro-gear pump.
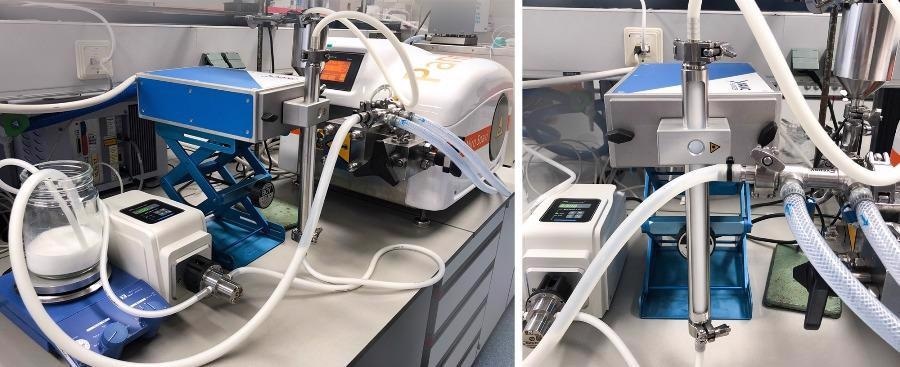
Figure 6. Set up for inline monitoring of the droplet size using the NFS during homogenization of the O/W emulsions. Image Credit: InProcess-LSP
Evaluation of Interaction Effects
To evaluate possible impact on diffusion rates due to high volume fractions, samples were taken from the reservoir at each setting in the stationary state. Dilution series of these samples were prepared using the 1% Tween solution down to concentrations φ < 0.005 and measured by the NFS in vials (no flow).
In addition, a dilution series of one other nano-emulsion (commercially available Intralipid, Z-av size 340 nm) at the same volume fraction (φ = 0.22) as the most concentrated sunflower O/W emulsion was examined to evaluate consistency of the ‘hindering factor’ d/deff (φ) between two different but similar nano-emulsions.
Influence of Surfactant on Solvent Viscosity
For proper data-analysis, the effect of the surfactant on the viscosity of the solvent was accounted for. A finite concentration Tween 20 enhances this viscosity, following the ‘Jones-Dole’ formula13 ηs = ηs (c). For our concentration (c0 = 8.2mM >> Critical Micelle Concentration) this would give ηs (c0) = ηs,0 ≃ 1.1ηwater but a fraction of the Tw20 is absorbed on droplet interfaces, which increases as the droplet size decreases during homogenization.
The net ‘free’ Tw20 concentration in the solvent is calculated from the specific droplet surface area1 S ≃ 9φ/d and the Tw20 specific molar surface area AT,M = 3.6 • 105 14, giving c(φ, d) = c0 − (9φ /AT,Md). This gives a droplet size dependent solvent viscosity ηs (d) and an implicit size dependence in the Stokes-Einstein form. For realtime conversion of the diffusion coefficient D to droplet size, we used an approximation ηs (φ, d) ≃ ηs,0 − ηwater [δ(φ)/d], where δ(φ) is a volume fraction dependent offset. The resulting conversion d ≃ [δ(φ)ηwater /ηs,0 ] + [kBT/3πηs,0D] can be integrated in the real-time analysis of the NFS system2.
Footnotes:
1 Formally S = 6φ/d3,2 with d3,2 the Sauter mean diameter. For the measured polydispersity levels, the ratio of d3,2 and the Z-av diameter d is ~2/3, giving the stated form.
2 This includes the temperature dependence of δ(φ),ηs,0 and ηwater.
Monitoring Homogenization of an Unstable Pharmaceutical OS/W Emulsion
The pharmaceutical emulsion consisted of organic-solvent droplets (~3 vol%, with dissolved API) dispersed in an aqueous solvent (effects of additives on viscosity were estimated negligible). The turbidity was very similar to the 5 vol% O/W emulsion above.
The emulsion was homogenized and monitored using the setup in Figure 5b, using a Panda1000 with a flow of ~20 L/hr. Here the NFS was coupled with a 1” flow cell. The pressure in the HPH was maintained constant during the process. After 39 minutes, the flow was halted for a period of c.a. 4 mins, to check the stability of the emulsion in the absence of flow.
Results
Real-Time Size Characterization of the O/W Emulsions
Figure 7a shows the monitoring results during the stepwise pressure changes for the 5 vol% O/W emulsion. A fast reduction of the droplet size (Zav) was observed after the pressure rise to 400 bar, going from c.a. 450 nm to somewhat below 350 nm in 50 min, as observed in Figure 7a.
After increase of the pressure to 600 bar the droplet size decreased to a minimum size of about 280 nm. Increasing the pressure to 800 bar results after about 30 minutes in a constant droplet size of 250 nm. A decrease in the PDI, from the beginning to the end of the process can also be observed in Figure 7a. Additionally, Figure 7b shows the PSD at different time points.
A significantly broader particle size distribution can be observed at early time points compared to close to the end time points. Over time the PSD becomes narrower and the mean peak shifts to smaller droplet sizes. These results confirm the expectation of droplet size and polydispersity changes during homogenization. Offline samples taken from the reservoir, measured in a glass vial without flow for comparison, are shown as circles in Figure 7a, and confirm the real-time inline data.
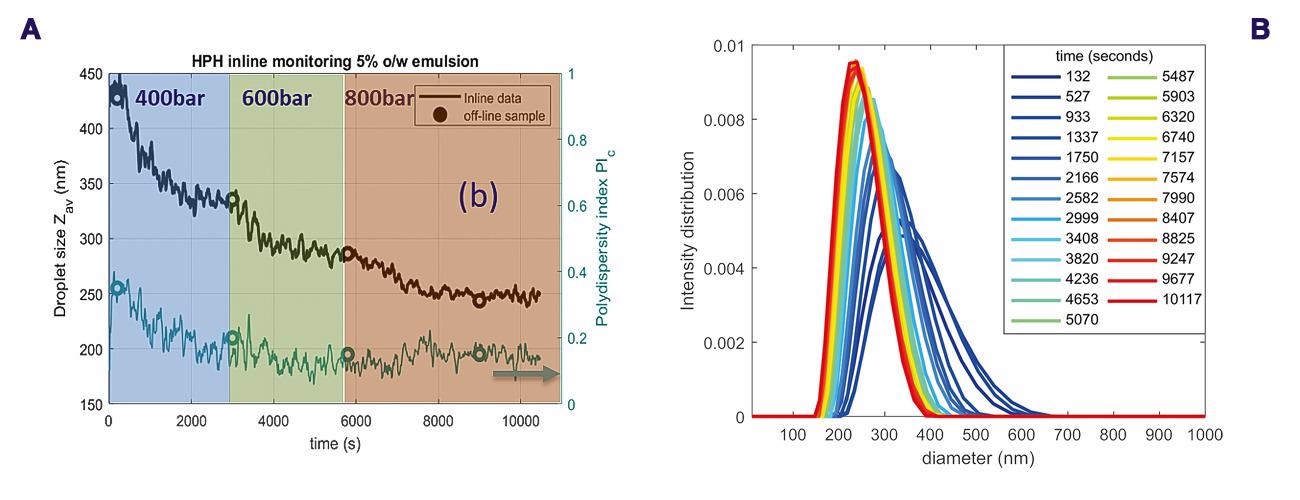
Figure 7. (a) Inline monitoring of size characteristics of the 5 vol% O/W emulsion following homogenization at the different pressures (b) droplet size distributions at different time points, the different line colors represent different time points (blue: from ±2 min to ±60 min, green-red: ±70 min to ±170 min). Image Credit: InProcess-LSP
Figure 8a shows the terminal ‘steady state’ droplet size data at the different concentrations obtained from all the HPH-runs, accounting for the ‘hindered diffusion’ for the 11 vol% and 22 vol% data. The trend of decrease in size and polydispersity is similar for all volume fractions, but the droplet sizes are somewhat larger for large concentration, while polydispersity is somewhat smaller.
These data evidence the capability of SR-DLS to measure samples at a broad range of concentrations and in the presence of flow. The size-concentration diagram for nano-emulsions in Figure 8b (calculated using emulsion optical parameters, lipid RI=1.47) illustrates the droplet size evolution during the three runs.
All three nano-emulsions are in a turbidity range inaccessible to other DLS methods.
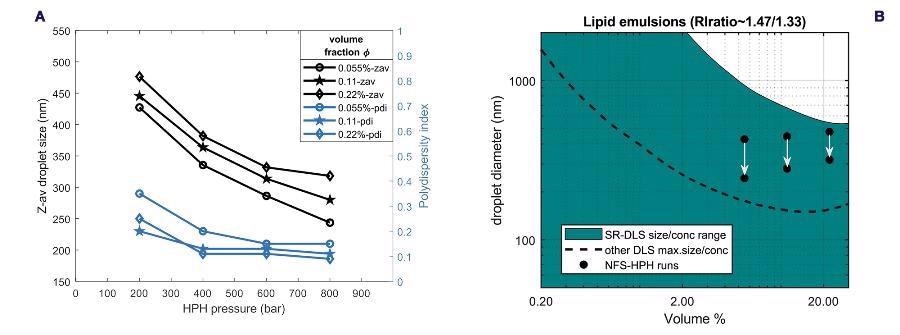
Figure 8. (a) Terminal droplet size and polydispersity versus homogenization pressure, obtained from inline monitoring of HPH runs for the three different volume fractions (b) Size-concentration regime diagram for sizing lipid/water emulsions using SR-DLS compared to other DLS systems. The black dots correspond to the initial (top) and final (bottom) droplet size during the HPH runs for the different volume fractions. Image Credit: InProcess-LSP
Evaluation of Interaction Effects
Results in Figure 9 show that for volume fractions φ = 0.055 the size correction due to hindered diffusion is almost negligible, but for φ = 0.109 and φ = 0.22 significant reduction of the diffusion is observed.
To obtain quantitative particle size information for these latter emulsions, the hindered diffusion correction factor must therefore be applied. For this type of emulsions, with significant polydispersity and interactions dominated by ‘excluded volume’, a size-independent calibration factor can adequately (within ~5%) convert in-line measured diffusion coefficient in concentrated samples to the actual droplet size.
The obtained correction factor of the intralipid sample with volume fraction equal to that of the most concentrated sunflower emulsion is very similar, confirming the consistency of the correction factors for similar formulations.
For comparison, the correction factors as estimated from the generalized Stokes-Einstein equation, based on the ratio of solvent viscosity and emulsion viscosity for the different volume fractions, is also shown. The difference with the actual observed scaling factors shows the difficulty of such a viscosity-based correction to generically account for hindered diffusion.
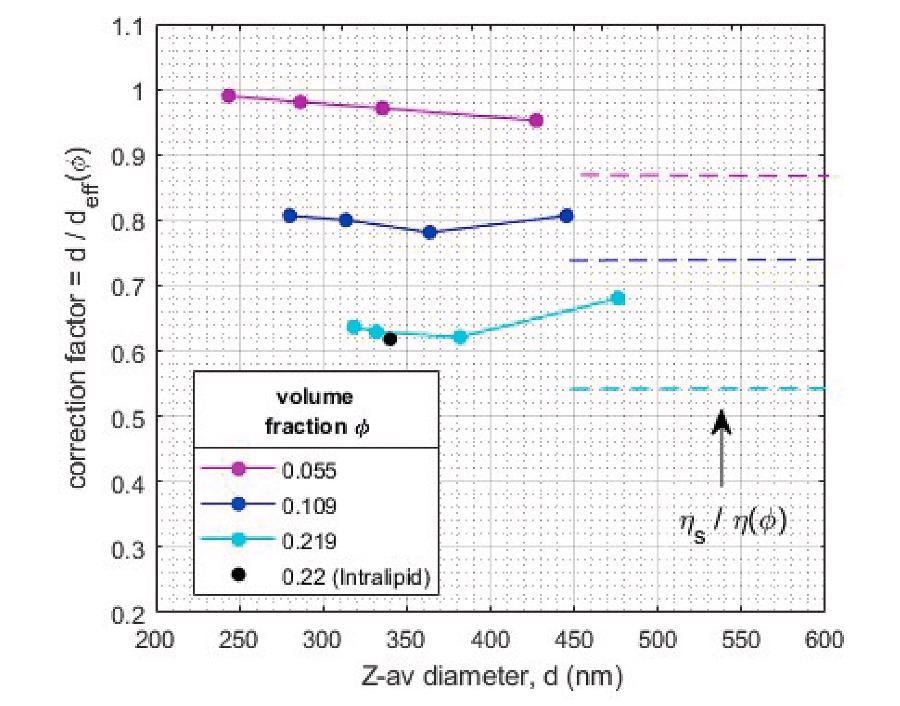
Figure 9. ‘Hindered diffusion’ correction factors for quantitative sizing of concentrated emulsions as determined from comparison of diluted and undiluted samples. Image Credit: InProcess-LSP
Monitoring Homogenization of the Unstable OS/W Emulsion
Figure 10 shows the monitoring during c.a. 40 minutes of the Z-average of nanodroplets during the emulsification of the organic solvent/water emulsion. At the start of the process the mean droplet size was c.a. 200 nm. Droplet size subsequently shows a weak decrease on prolonged homogenization, which sets in most clearly after c.a. 20 mins. After 39 minutes when the flow was stopped, the droplet size shows a clear increase from c.a. 170 nm to c.a. 330 nm. When the flow is started again, the droplet size almost instantaneously decreases and starts to retrace the slow decreasing trend observed before the diversion.
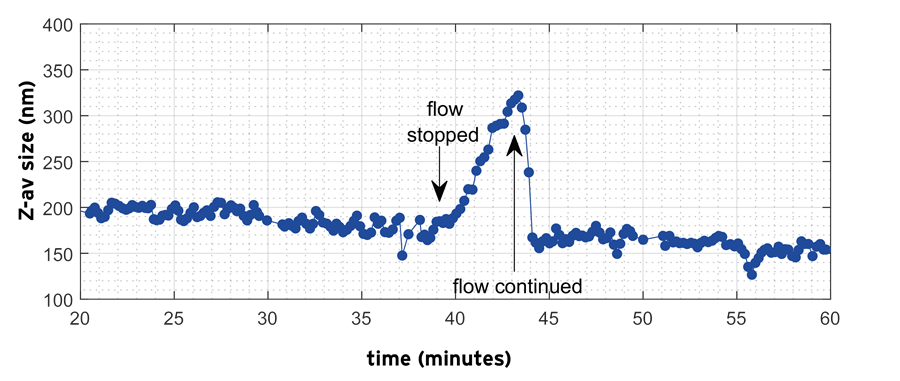
Figure 10. Inline measurement of Z-average droplet size using the NFS during homogenization and interruption of flow for the OS/W emulsion. Image Credit: InProcess-LSP
The size increase (and reduction) seen before (and after) the diversion is not a measurement artefact: the NFS algorithms provide separate analysis of the flow and the diffusive (Brownian) motion for each measurement and the latter provides the size characteristics.
This data clearly shows how the NFS inline monitoring capabilities can be employed for better understanding of homogenization of emulsions showing complex instability behavior.
Due to the unstable nature of the emulsion, no reliable offline measurements of droplet size during processing could be made in practice. The use of a PAT tool for size characterization is thus particularly valuable in this case.
Conclusion
A novel instrument (the NanoFlowSizer) and methodology for inline nanoparticle sizing is presented to enable rapid and efficient process control and formulation development.
Results of rapid monitoring nano-emulsion size evolution in two types of High Pressure Homogenization process show that (i) the size of nanodroplets can be measured inline in real-time, without the need of dilution and (ii) that the instrument allows size characterization in situations where standard method fail e.g. due to limited stability.
The large accessible concentration and turbidity range offered by Spatially Resolved DLS requires a consequently good understanding of possible effects on diffusion rates in undiluted samples.
This effect, as well as dynamic viscosity changes during processing, can be calculated or empirically determined and incorporated effectively to obtain real-time size monitoring.
The ability to obtain droplet/particle size information continuously during processing for understanding and controlling processes and formulation parameters highlights the instruments added value from R&D up to commercial manufacturing.
References
- P. Walstra, “8 Emulsions,” in Fundamentals of Interface and Colloid Science, vol. 5, no. C, Academic Press Inc., 2005, pp. 1–94.
- F. Goodarzi and S. Zendehboudi, “A Comprehensive Review on Emulsions and Emulsion Stability in Chemical and Energy Industries,” Can. J. Chem. Eng., vol. 97, no. 1, pp. 281–309, 2019.
- P. Ganesan, G. Karthivashan, S. Y. Park, J. Kim, and D.-K. Choi, “Microfluidization trends in the development of nanodelivery systems and applications in chronic disease treatments.,” Int. J. Nanomedicine, vol. 13, pp. 6109–6121, 2018.
- S. Mahdi Jafari, Y. He, and B. Bhandari, “Nano-Emulsion Production by Sonication and Microfluidization—A Comparison,” Int. J. Food Prop., vol. 9, no. 3, pp. 475–485, Sep. 2006.
- H. Jasmina, O. Džana, E. Alisa, V. Edina, and R. Ognjenka, “PREPARATION OF NANOEMULSIONS BY HIGH-ENERGY AND LOWENERGYEMULSIFICATION METHODS,” in CMBEBIH 2017, 2017, pp. 317–322.
- A. Gupta, H. B. Eral, T. A. Hatton, and P. S. Doyle, “Controlling and predicting droplet size of nanoemulsions: Scaling relations with experimental validation,” Soft Matter, vol. 12, no. 5, pp. 1452–1458, 2016.
- A. Håkansson, “Emulsion Formation by Homogenization: Current Understanding and Future Perspectives,” Annu. Rev. Food Sci. Technol., 2019.
- T. Bastogne, “Quality-by-design of nanopharmaceuticals – a state of the art,” Nanomedicine: Nanotechnology, Biology, and Medicine. 2017.
- S. Soares, J. Sousa, A. Pais, and C. Vitorino, “Nanomedicine: Principles, properties, and regulatory issues,” Frontiers in Chemistry, vol. 6, no. AUG. Frontiers Media S.A., p. 360, 01-Aug-2018.
- R. Besseling, M. Damen, J. Wijgergangs, M. Hermes, G. Wynia, and A. Gerich, “New unique PAT method and instrument for real-time inline size characterization of concentrated, flowing nanosuspensions,” Eur. J. Pharm. Sci., vol. 133, pp. 205–213, May 2019.
- M. S. Wertheim, “Exact solution of the percus-yevick integral equation for hard spheres,” Phys. Rev. Lett., vol. 10, no. 8, pp. 321–323, 1963.
- P. N. Segrè, S. P. Meeker, P. N. Pusey, and W. C. K. Poon, “Viscosity and structural relaxation in suspensions of hard-sphere colloids,” Phys. Rev. Lett., vol. 75, no. 5, pp. 958–961, Jul. 1995.
- K. Szymczyk, M. Szaniawska, and A. Taraba, “Micellar Parameters of Aqueous Solutions of Tween 20 and 60 at Different Temperatures: Volumetric and Viscometric Study,” Colloids and Interfaces, vol. 2, no. 3, p. 34, Aug. 2018.
- K. Szymczyk, A. Zdziennicka, and B. Jańczuk, “Adsorption and Aggregation Properties of Some Polysorbates at Different Temperatures,” J. Solution Chem., vol. 47, no. 11, pp. 1824–1840, Nov. 2018.

This information has been sourced, reviewed and adapted from materials provided by InProcess-LSP.
For more information on this source, please visit InProcess-LSP.
This article is written by Rut Besseling, InProcessLSP.