Two or more materials of distinct physical or chemical properties, forming a single material, are defined as composite materials. These specific materials exist as discreet entities, but their combination of finished material properties is notably different from those of the constituent materials.
Many types of composite materials are available, but the term typically refers to systems that consist of a polymer matrix and a fiber-based filler.1 Other commonly encountered fillers include nanotubes, nanoparticles, whiskers and flakes.2
Figure 1 displays a series of example cross-sections of composite polymer materials, highlighting the fillers’ structure within the polymer matrix.3 The key benefit of these materials is their enhanced mechanical properties, for example, high specific strength and impact resistance. The interface between the resin matrix and fiber remains the key factor in the enhanced mechanical properties of fiber-reinforced composites.4
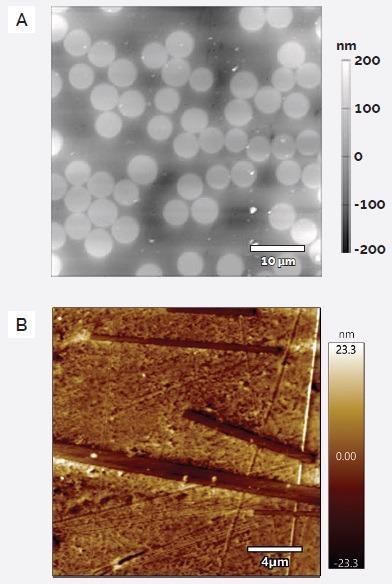
Figure 1. AFM topography images of (a) carbon fiber/epoxy resin composite and (b) glass flake/resin composite. Image Credit: Oxford Instruments Asylum Research Inc.
Effective composites tend to feature an interfacial layer between these components, resulting from strong and stable adhesive interactions. A number of methods can be employed to encourage the formation of this interfacial layer, for example, mechanical bonding and physical and chemical coupling.1 One widely used method involves coating the filler with a hydrophobic substance to generate bonding sites for the resin.2
The ability to accurately characterize this interfacial layer is vital when it comes to comprehending and optimizing the development and production of composite materials with enhanced mechanical properties. Appropriate characterization methods are especially important, as this layer can range from nanometer to micrometer in length scales.
Atomic force microscopy (AFM) is one such technique able to offer the characterization of mechanical properties and morphology at the nanoscale. Atomic force microscopy employs an ultra-sharp tip which raster scans the sample, mapping its topography via a series of physical interactions between the tip and sample. Next-generation AFMs such as the Asylum Research Cypher series of AFMs provide sub-nanometer spatial resolution that exceeds that of scanning electron microscopes (SEM). AFMs are also able to provide accurate results without the need for the complex sample preparation requirements associated with SEM and transmission electron microscopy (TEM). Unlike SEM, the height information acquired via AFM is entirely quantitative, facilitating accurate roughness measurements.
Figure 1 shows a series of example topographical images with color scales based on height. The lateral resolution of this method can range from sub-nanometer to a few nanometers, depending on factors such as the quality of the AFM, the type of tip used, the nature of the sample and the imaging conditions utilized. Height resolution (Z-axis) is essentially a function of AFM quality. This may be as low as 5-10 pm for advanced AFMs like the Asylum Research Cypher AFMs or more than 50 pm for more conventionally performing AFMs.
Figure 2 provides an example of morphological characterization in composite research, whereby PET fibers have been chemically treated with a number of processes.5 The goal of this chemical treatment was to enhance the binding between the fibers and matrix. AFM was employed in this scenario to assess the extent of surface modification or degradation stemming from these chemical processes.
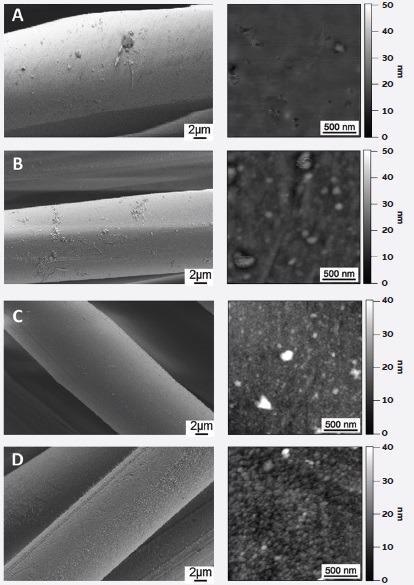
Figure 2. SEM micrographs (left) and AFM topography images (right) of PET fibers after four different surface treatments (A-D). Adapted from reference 5. Image Credit: Oxford Instruments Asylum Research Inc.
The most frequently employed imaging mode in an AFM is referred to as ‘tapping mode.’ This mode sees the probe excited at resonance while it scans, essentially tapping the surface throughout the process. This mode is rapid, high resolution and gentle on both the tip and sample. One complementary piece of information is the phase lag between tip response and drive signal. The presence of contrast in this channel highlights that the tip is interacting with the sample in different ways, providing insight into differences in mechanical properties. This is a qualitative indicator for mechanical properties, but there are also a number of AFM techniques able to provide quantitative nanomechanical information.
The first technique to be developed for AFM was force mapping, a method that sees the probe lowered to the surface and allowed to make contact until a defined force is applied. The probe is then retracted. During this process, the deflection (or force) of the probe is measured and recorded against Z distance to produce a ‘force-distance plot. A range of useful mechanical properties can be extracted from this type of measurement, including adhesion and Young’s modulus.
In order to create a force map, force measurements must be performed across a grid of points. It is possible to calculate mechanical properties for each force curve at each pixel on this grid, resulting in comprehensive maps of mechanical properties. Figure 3 provides a series of example force maps carried out on polymer-based composite materials. These example materials confirm that the filler material (high modulus) can be resolved from the polymer matrix (low modulus).6,7 These maps have the potential to display mechanical information on a spatially resolved basis, but the resolution achieved with force mapping remains relatively low due to the speed of acquisition. The relatively low resolution of the maps in this instance prompted the need for further analysis and modeling to better understand the interfacial layer.
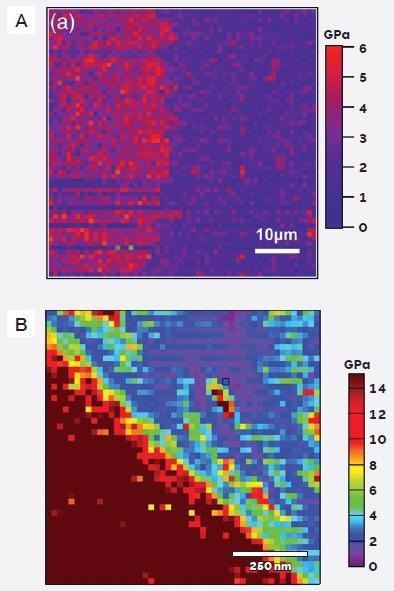
Figure 3 . Force maps at the filler/matrix interface of (a) PET/epoxy resin composite and (b) carbon fiber/epoxy resin composite. Adapted from references 6 and 7. Image Credit: Oxford Instruments Asylum Research Inc.
Exclusive nanomechanical imaging modes on Asylum Research AFMs provide the complementary mapping of mechanical properties – for example, storage and loss moduli - at the nanoscale, which can help identify composite components. These modes include AM-FM Viscoelastic Mapping Mode and Fast Force Mapping (FFM).
A single force curve typically takes around 1 second to construct, meaning that a large map of several thousands of pixels would take several hours to complete. Thankfully, this slow acquisition time has been improved by recent advances in AFM systems and related technology, allowing the acquisition of higher resolution maps. AFM systems from Oxford Instruments Asylum Research refer to this advanced measurement mode as fast force mapping (FFM). Using FFM, up to 2,500 force curves can be obtained per second, allowing mechanical maps to be acquired at the same resolutions and speeds as standard imaging modes.
FFM sees a single force curve acquired at each pixel, allowing the full set of data for each curve to be captured. This dataset features both the deflection and Z sensor signals, meaning that comprehensive and in-depth analyses can be undertaken post-measurement. It is important to note that full acquisition of the force curve is not always possible on systems from other manufacturers, resulting in mechanical calculations based on a limited number of data points, ultimately leading to data inaccuracies.
Figure 4 features an example of FFM data from the analysis of a rubber composite.8 This work saw a polyamide cord made from twisted fibers being embedded in rubber to enhance wear resistance. Cords in this example were dipped in resorcinol-formaldehyde-latex (RFL) to strengthen adhesion between the cords and rubber. The FFM map successfully resolved these three components, confirming that the interfacial layer is ~2 µm wide with an intermediate modulus value versus the softer rubber and stiffer polyamide cord.
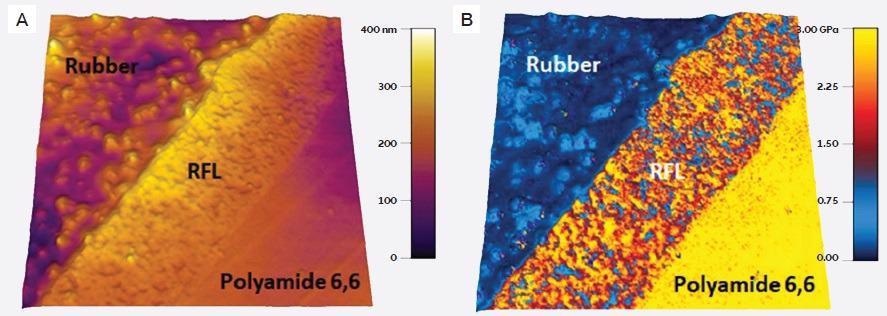
Figure 4. FFM measurements on a polyamide/rubber composite with a resorcinol-formaldehyde-latex additive. These are 5 μm scans captured simultaneously, showing (a) topography and (b) Young’s modulus. Adapted from reference 8. Image Credit: Oxford Instruments Asylum Research Inc.
Despite these improvements in potential resolution afforded by FFM, methods based on the use of force curves are sometimes limited due to the need for relatively large indents to ensure reliable measurements. Indentations should generally be larger than the sample’s roughness in order to eliminate topographical effects. This need is highlighted in the example shown in Figure 4, which exhibited an interfacial layer ~2 µm in width.
Amplitude modulation-frequency modulation (AM-FM) viscoelastic mapping mode is one alternative nanomechanical technique that improves this resolution. This technique is based on tapping mode and sees the probe excited at two frequencies simultaneously. The first frequency is the fundamental resonant frequency used to generate topography images (much like standard tapping mode), while the second frequency is another flexural resonance that is tracked to provide nanomechanical data. The shift in this frequency is extremely sensitive to the sample’s mechanical properties, thereby removing the need for high indentations and improving resolution. Parameters such as dissipation, loss tangent, Young’s modulus and indentation can be determined via AM-FM to provide viscoelastic mapping of a sample. The raw frequency signal can also be obtained as a qualitative measure of sample stiffness. As this method is based on tapping mode, it shares that mode’s advantages of being rapid, gentle and straightforward.
Figure 5 features an example AM-FM measurement performed on a resin reinforced with glass fibers. To improve adhesion between these materials, it was necessary to coat crystalline nanocellulose (CNC) particles on the surface of the fibers. Fibers were imaged, both with and without the treatment.9
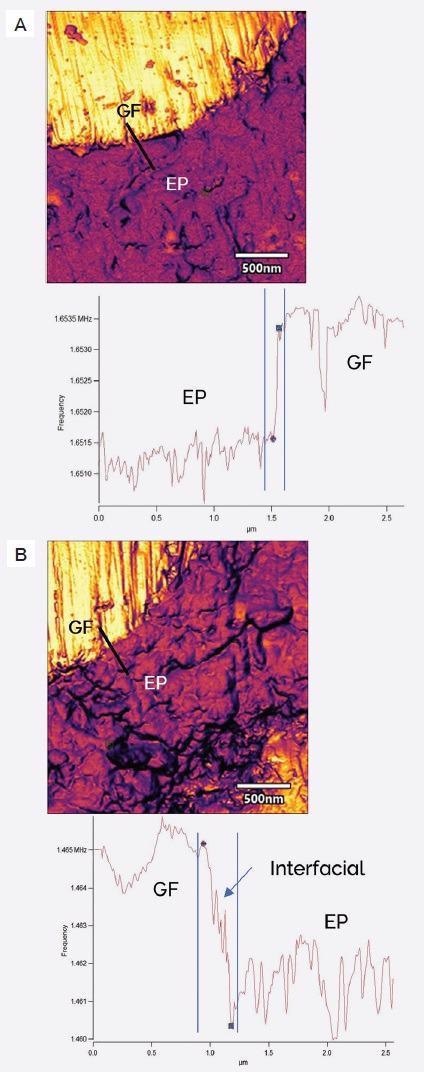
Figure 5. AM-FM stiffness maps in raw frequency units (top) and associated line sections (bottom) without (a) and with (b) crystalline nanocellulose additive. Adapted from reference 9. Image Credit: Oxford Instruments Asylum Research Inc.
In this experiment, the authors decided to employ the raw frequency images instead of completing the required calibration to calculate quantitative modulus values. Line sections across the interface between the resin and fiber indicated the existence of an interfacial layer around 235 nm in thickness. This example confidently highlights AM-FM’s ability to provide high resolution nanomechanical mapping.
Adding fillers such as fibers and particles into polymers to fabricate composite materials is a frequently employed approach to enhancing mechanical properties. The interfacial layer between filler and matrix is key to the final composite system’s overall strength and stability. Understanding and characterizing this interfacial layer is, therefore, an essential step in the development of polymer-based composite materials.
AFM is a high-resolution technique able to provide information on a sample’s mechanical properties and its morphology at the nanoscale. Oxford Instruments Asylum Research’s portfolio of AFM systems are able to accommodate a wide range of mechanical techniques, facilitating the accurate characterization of interfacial layers at high resolution.
References
- Piggott, M.R. and Chua, P.S. “The Glass Fibre- Polymer Interface: II Work of Fracture and Shear Stresses.” Composites Science and Technology, 1985, Composites Science and Technology, Vol. 22, pp. 107-119.
- Gajapriya, M., Somasundaram, J., & Geetha, R. V. “Fillers in composite resins-recent advances.” European Journal of Molecular & Clinical Medicine, 7(01), 2020.
- Henry, T. C., Cole, D. P., Gardea, F., & Haynes, R. A. (2018). “Interphase Mechanics in Fatigued Carbon Fiber Composite Materials.” Micro and Nanomechanics, Volume 5 (pp. 29-35). Springer, Cham.
- Ehrburger, P. and Donnet, J.B. “Interface in Composite Materials,” Phil. Trans. R. Sot. London, A294 (1980), 495-505.
- Vecchiato, S., Ahrens, J., Pellis, A., Scaini, D., Mueller, B., Herrero Acero, E., & Guebitz, G. M. (2017). Enzymatic functionalization of HMLS- polyethylene terephthalate fabrics improves the adhesion to rubber. ACS Sustainable Chemistry & Engineering, 5(8), 6456-6465.
- Cano Murillo, N., Ghasem Zadeh Khorasani, M., Silbernagl, D., Hahn, M. B., Hodoroaba, V. D., & Sturm, H. (2021). Nanomechanical study of polycarbonate/boehmite nanoparticles/epoxy ternary composite and their interphases. Journal of Applied Polymer Science, 138(12), 50231.
- Babu, L. K., Mishra, K., & Singh, R. P. (2018). Near– fiber effects of UV irradiation on the fiber–matrix interphase: A combined experimental and numerical investigation. Materials & Design, 157, 294-302.
- Enganati, S. K., Addiego, F., Fernandes, J. P. C., Koutsawa, Y., Zielinski, B., Ruch, D., & Mertz, G. (2021). Multiscale characterization of the interfacial region in flexible rubber composites: Initial structure and evolution upon thermal treatment. Polymer Testing, 98, 107203.
- Kumar, S., Falzon, B. G., Kun, J., Wilson, E., Graninger, G., & Hawkins, S. C. (2020). High performance multiscale glass fibre epoxy composites integrated with cellulose nanocrystals for advanced structural applications. Composites Part A: Applied Science and Manufacturing, 131, 105801.

This information has been sourced, reviewed and adapted from materials provided by Oxford Instruments Asylum Research Inc.
For more information on this source, please visit Oxford Instruments Asylum Research Inc.