The significant majority of SEMs (Scanning Electron Microscopes) are equipped with EDS (Energy Dispersive X-Ray Spectroscopy, also known as EDX), which facilitates the quantitative analysis of chemical elements present in a sample.
Exciting developments in MountainsSpectral® software have recently paved the way for combining and comparing these characteristics using surface topography to better comprehend material behavior. In this article, the latest tools from Digital Surf are explored, along with their application potential.

Article author: Renata Lewandowska, product manager for spectral applications, Digital SuImage Credit: Digital Surf
3D Reconstruction
A number of years ago, the Digital Surf team revealed a new, groundbreaking method for quickly constructing a 3D model from two successive scans or four 4-quadrant images from an SEM.
View the full method in Digital Surf’s webinar: bit.ly/3D-reconstruction
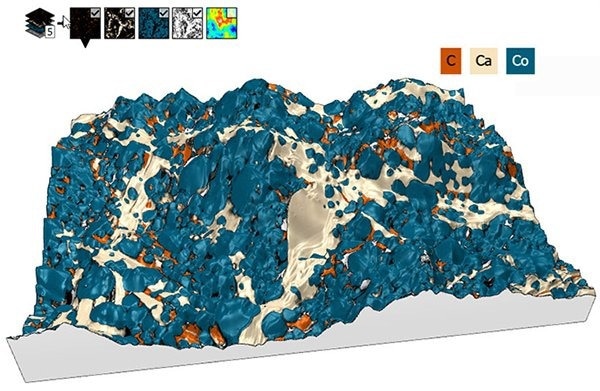
3D model of surface topography with overlay of chemical composition on a Cobaltite sample. Courtesy of Emmanuel Guilmeau, CRISMAT (Caen, France), Jean-Claude Ménard, JEOL France. Image Credit: Digital Surf
Colocalization Tools for Overlaying Spectral Data
Often, users of SEM have the ability to create EDS maps of the sample under investigation. However, combining datasets that vary in nature at different scales to collectively evaluate them can be particularly complex. MountainsSpectral® incorporates a streamlined method for conducting this task, all contained within a single software package.
Connecting Background Data with Overlays
The initial step in the process is selecting the desired background and generating a Colocalization study.
This could be a 2D image, but in the case presented here (a Cobaltite sample imaged with SEM and EDS), a 3D topography was used. Next, the user can choose to add overlay images. Three EDS chemical maps were chosen as overlay images in the present case.
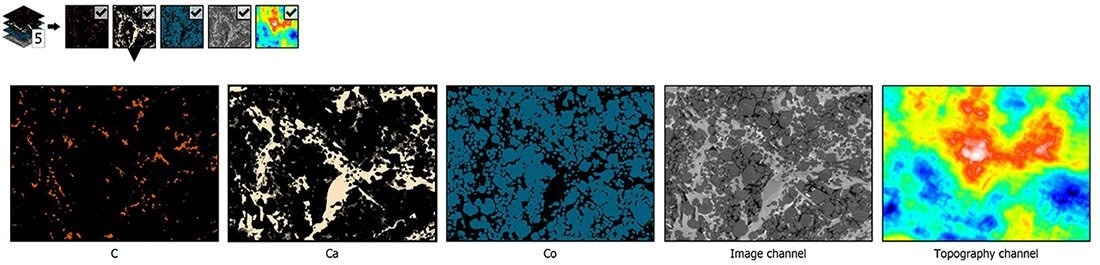
Grid view of all data (background and overlays) used to perform colocalization. Image Credit: Digital Surf
Transparency settings can be manipulated to monitor the positioning of the overlays on the background – this is particularly helpful when the two datasets are not at the same scale.
There are numerous methods available to position overlays with greater precision. In this example, the Use points method was employed to determine similar structures on the two datasets and generate pairs of points to be colocalized with each other.
Finally, the Composite rendering tool in MountainsSpectral® was used to select the relevant EDS maps to work with and mix colors from these.
Showcasing Data in 3D
The 3D visualization and manipulation of data can help users better interpret analyzed data. Today, a wide range of methods are available for creating a 3D view in MountainsSpectral®.
The Generate 3D view tool in the Colocalization study is one way to visualize data in 3D with minimal effort. This technique utilizes the topographic values taken from the reconstructed SEM image and pastes the color image from the colocalization as an overlay.
Alternatively, using the Generate whole content feature, all colocalization datasets (background and overlay images) can be acquired as a Multi-channel image. This has the added benefit of opening up further data processing possibilities (access to Operators and Studies on Multi-channel images). This method also offers increased flexibility for modifying composition once the colocalization has been carried out.
Whichever method is employed, once the 3D view has been created, there is the immediate benefit of access to a multitude of enhancement options: amplify height representations, modify rendering and gloss, and define the optimal lighting conditions for the sample.
Finally, the Animated view facilitates flight simulation over the data, following one of many predefined paths. All these are great tools for producing an exceptional presentation.
Correlation Made Easy
In addition to generating an esthetically pleasing image, the workflow outlined in this article facilitates the correlation between various kinds of instrument data (SEM & EDS images).
The capability to simply hide or unhide the different chemical maps (calcium, carbon, etc.) on 3D data enables the user to understand the relationships between the various components.
Correlation in Action
Nothing beats a demonstration to better understand new tools and how they work. Get a step-by-step demonstration of correlation with Renata Lewandowska, product manager for spectral applications at Digital Surf, by watching the webinar on “Spectroscopy data preparation, analysis and correlation with MountainsSpectral®.”
Click here to watch the webinar.

This information has been sourced, reviewed and adapted from materials provided by Digital Surf.
For more information on this source, please visit Digital Surf.