Over the last 10 years, there has been a significant increase in the production and application of engineered nanomaterials (ENMs) which has increased the possibility of their release into the surroundings. As a result, it is has become important to study the impact of these ENMs on the environment.
Suitable risk assessment and management of ENMs with respect to the environment needs quantitative analyses of both effects and exposure which should be carried out by in situ analysis. However, given the fact that concentration of nanoparticles is extremely low, most analytical methods cannot be used for environmental matrices except Single Particle ICP-MS.
Single Particle Inductively Coupled Plasma Mass Spectrometry
Earlier, tunneling electron microscopy (TEM) and dispersive light scatter (DLS) techniques were used to measure particle size, while ultrafiltration was used to measure dissolved content. However, these methods have certain limitations with regard to determining low concentrations in environmental waters.
Single particle inductively coupled plasma mass spectrometry (SP-ICP-MS), on the other hand, is a fast and efficient technique that provides a suitable option for the detection and characterization of metal nanoparticles at low concentrations down to as low as 1000 particle/mL.
The SP-ICP-MS technique not only provides more data, but also measures particle concentration, particle size distribution, and the quantity of dissolved metal. This article explores the effectiveness of SP-ICP-MS for detecting and characterizing metal nanoparticles in complex environmental waters where they may be involved in different physicochemical processes (Figure 1).
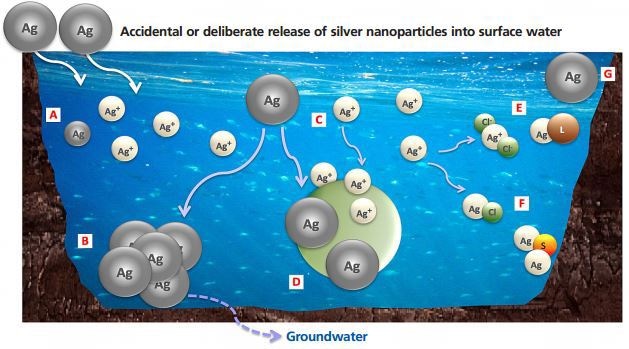
Figure 1. (A) Dissolution process leading to free ions release and smaller particles; (B) Aggregation into larger particles; (C, D) Adsorption of released Ag+ and nAg, respectively; (E) Formation of soluble complexes; (F) Reaction with other components in the water, which may result in precipitation; (G) nAg remaining stable.
The principle of SP-ICP-MS is based on fast, continuous measurements of the signal intensity generated by a particle. The technique can be used for measuring silver nanoparticles (AgNP), dissolved silver, soluble complexes, and free ions. Because nanosilver is commonly used in consumer products, it is among the most frequently studied nanoparticles.
Experimental Framework
The NexION 350X Inductively Coupled Plasma Mass Spectrometer (ICP-MS) from PerkinElmer was utilized for data acquisition by means of the Nano Application Module integrated in Syngistix for ICP-MS software.
The sample introduction solution includes a glass cyclonic spray chamber, a 2.0 mm quartz injector and type C0.5 concentric glass nebulizer. Table 1 shows the instrumental parameters for SP-ICP-MS instrument.
Table 1. Instrumental parameters for SP-ICP-MS data acquisition
| Parameter |
Value |
| Instrument |
NexION 350X ICP-MS |
| Nebulizer |
Concentric |
| Spray Chamber |
Cyclonic |
| Torch and Injector |
Quartz Torch and Quartz 2.0 mm bore injector |
| Power (W) |
1600 |
| Plasma Gas (L/min) |
18 |
| Aux Gas (L/min) |
1.2 |
| Neb Gas (L/min) |
0.97 |
| Sample Uptake Rate (mL/min) |
0.5 |
| Sample Tubing |
Black/Black |
| Dwell Time (µs) |
100 |
| Sampling Time (s) |
60 |
Suspensions of silver and gold nanoparticles were used for the study. A NIST reference material (RM 8013) containing a suspension of gold nanoparticles was utilized to determine the transport efficiency of the system (i.e. how efficiently particles are transferred from the solution/sample to the plasma). Suspensions of AgNP included a bare nanosilver suspension with 80 nm nominal diameter and citrate coated nanosilver suspensions with 40 and 80 nm diameter.
Water samples obtained from Rivière des Prairies, Canada were filtered and spiked with AgNP. Suspensions of AgNP were then spiked into the water samples with concentrations varying between 2.5 and 33.1 µg Ag L-1 and allowed to equilibrate with mild and continuous shaking. Before SP-ICP-MS analysis, small aliquots of the water samples were diluted to less than 0.2 µg Ag L-1.
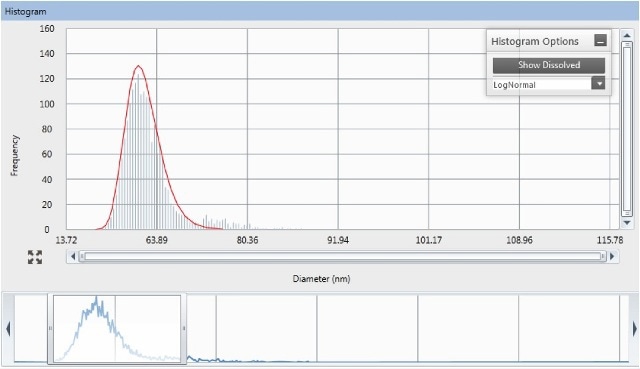
Figure 2. Interactive view of data acquisition with Syngistix for ICP-MS software: signal intensity as a function of acquisition time for silver nanoparticles (bare nAg, 60nm nominal diameter, total metal concentration 200.8ng/L) in surface water.
For each sample, data acquisition was carried out in triplicate measurements, and deionized (DI) water was measured between replicates to check for any memory effect. Figure 2 shows results from the Syngistix Nano Application Module, which produces frequency vs. size plots. An interactive integration window in the software allows the user to set the integration area.
Results and Discussion
Following filtration of surface waters down to 0.2 µm, Nanoparticle Tracking Analysis (NTA), which was performed utilizing the LM14 device with a 532 nm green laser, revealed the presence of significant amounts of colloidal particles having a typical diameter of ca. 110 nm.
This means that when metal nanoparticles are added to this complex matrix, it will be difficult to differentiate the metal nanoparticles from the other colloidal particles using common techniques such as TEM, DLS and NTA. It would also be difficult to determine the dissolved fraction which is generally carried out by ultrafiltration technique. As a result, the amount of dissolved metal cannot be measured accurately.
In contrast, measurements performed with SP-ICP-MS were more effective when compared to other techniques. In fact, even the presence of other particles does not affect the analysis of AgNP because the Ag signal is not interfered with by other particles.
Figures 3, 4 and 5 depict the average particle diameter along with the percentage of dissolved metal in river and pure water. In all the instances, the particle size of the nanoparticles remains constant, as shown in Figures 3a, 4a and 5a. For particle suspensions greater than 40 nm diameter, approximately 50% to 80% of the particles persist for a minimum of five days of equilibration in both surface and pure water, as shown in Figures 3b and 4b.
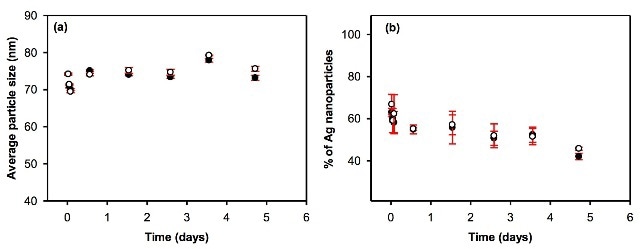
Figure 3. Evolution of (a) the average particle size and (b) the proportion of particulate silver as a function of equilibration time in pure (l) and surface (o) waters. Waters were spiked with 80nm citrate-coated nAg, and the total metal concentrations were equal to 72.2 and 72.4 ng L-1 in DI water and surface water, respectively.
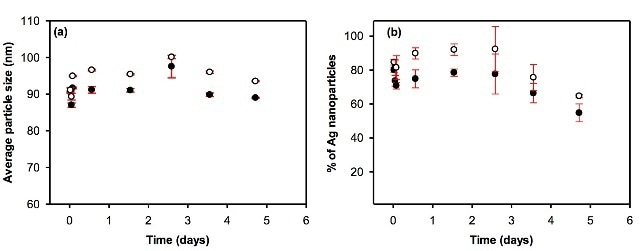
Figure 4. Evolution of (a) the average particle size and (b) the proportion of particulate silver as a function of equilibration time in pure (l) and surface (o) waters. Waters were spiked with uncoated 80 nm nAg, and the total metal concentrations were equal to 196.4 and 200.8 ng L-1 in DI water and surface water, respectively.
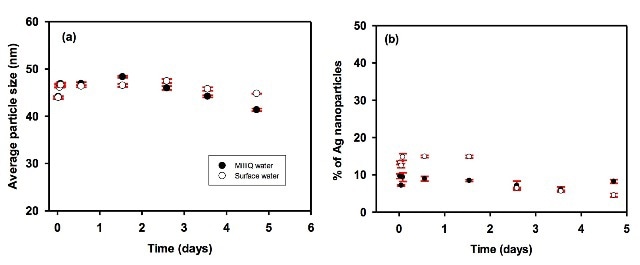
Figure 5. Evolution of (a) the average particle size and (b) the proportion of particulate silver as a function of equilibration time in pure (l) and surface (o) waters. Waters were spiked with 40 nm citrate-coated nAg, and the total metal concentrations were equal to 135.8 and 133.7 ng L-1 in DI water and surface water, respectively.
Moreover, the coating does not appear to have any major influence on the dissolution of nanoparticles over time at low concentration, given that suspensions of bare and citrate-coated AgNP demonstrated only a small reduction of particulate silver by ca. 20% during the five-day period.
Smaller particles with less than 40 nm diameters dissolve in larger proportions, as shown in Figure 5b. However, care should be taken as the technique cannot currently detect particles with diameters less than 20 nm.
Particles less than ca. 15 nm will be wrongly counted as dissolved metal. In bare AgNP suspension, the percentage of particles, as well as average particle size, was higher in surface water than that of deionized water (Figure 4).
In the citrate-coated AgNP suspension, no major difference in behavior was observed in either surface or deionized water. The reason is that when compared to citrate-stabilized nanoparticles, bare nanoparticles are more amenable to aggregation. But generally, no considerable aggregation was noted.
Conclusion
The Nano Application Module in the Syngistix for ICP-MS software helped in analyzing the characteristics of silver nanoparticles in surface water sans any need for manual data processing.
The method has enabled the selective measurement of dynamic particle size, dissolution, and aggregation at very low concentrations. SP-ICP-MS can be effectively used to obtain information related to the outcome of low-concentration metal nanoparticles in complex environmental waters.

This information has been sourced, reviewed and adapted from materials provided by PerkinElmer Inc.
For more information on this source, please visit PerkinElmer Inc.