Silver nanoparticles (AgNPs) are the most widely used nanoparticles in consumer products, thanks to their antimicrobial properties. The small size and high surface area of AgNPs increase their efficacy as an antimicrobial through high reaction rates. Besides being used in clothing, food cutting boards and food containers, colloidal and nano silver particles are also used in dietary supplements to strengthen a person’s immune system.
In that regard, many analytical methods are generally required to determine the parameters such as particle size, shape, composition, concentration, size distribution, dissolution and agglomeration tracking.
Single particle inductively coupled plasma mass spectrometry (SP-ICP-MS) is a fast, precise, and easy to use analytical technique that allows the measurement of the above-mentioned parameters is a single analysis.
It also discerns particulate and ionic forms of desired elemental composition reaching the plasma source without any prior sample preparation or separation technique, reducing operating costs to a minimum. The resulting data gives information on particle size, size distribution, particle concentration, as well as the dissolved concentration.
Hence, SP-ICP-MS is the ideal technique to count and size particles in various types on samples. This article discusses the application of a PerkinElmer NexION® 350D ICP-MS in single particle mode to characterize silver nanoparticles in dietary supplements.
Experimental Procedure
Sample preparation involved placing of reference AgNPs and three dietary supplement samples (Figure 1) in an ultrasonic bath for five minutes in order to reduce agglomeration by homogenously distributing the particles in the solutions.
The samples and reference solutions were sequentially diluted in polyethylene 50 mL sample tubes using laboratory Type I deionized (DI) water to achieve a particle concentration of roughly 200,000 particles/mL so that individual particles can be measured and particle coincidence can be minimized.
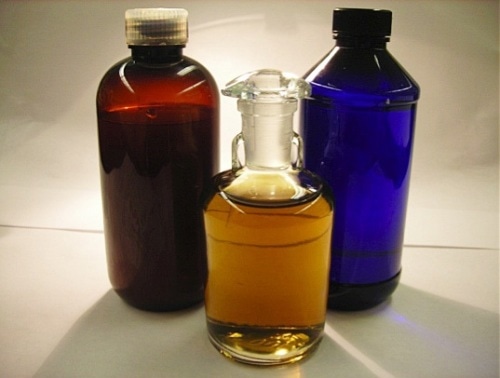
Figure 1. Three commercially available dietary supplements containing silver nanoparticles used in this work.
A combination of a standard nebulizer and spray chamber was used to introduce aqueous samples containing dispersed AgNPs into the plasma for ionization. For accurate measurements of the resulting burst of ions, the instrument’s quadrupole and measurement electronics must have the ability to perform continuous data acquisition with dwell times less than 100 µs. A real-time signal generated from the cloud of ions of a single nanoparticle is depicted in Figure 2.
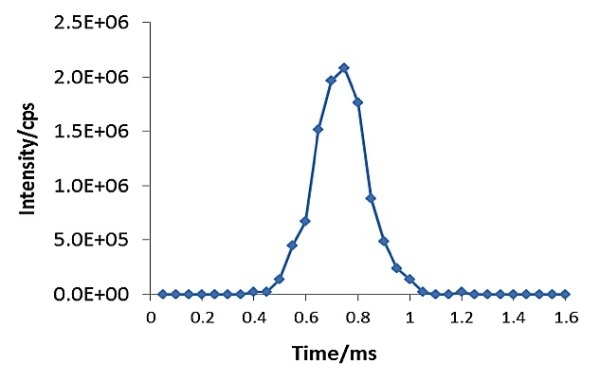
Figure 2. Signal of a single silver nanoparticle captured by SP-ICP-MS. Data acquired at 50µsec dwell time and zero quadrupole settling time.
This experiment used a PerkinElmer NexION® 350D ICP-MS operating in single particle mode that performs continuous data acquisition using a dwell time of 50 µsec while eliminating the settling times between readings.
As a result, accurate information about particle count and size is provided. SP-ICP-MS processes data by counting each particle entering the plasma source and differentiating between dissolved metal and particles.
The analysis of dissolved elements using an ICP-MS provides a steady-state signal (Figure 3a). Conversely, the analysis of a dilute suspension of nanoparticles shows ion bursts or clouds from individual nanoparticles (Figure 3b).
The Syngistix™ Nano Application Module for SP-ICP-MS from PerkinElmer computes the concentration of particles (particles/mL), the metal solution concentration (µg/L), and the size and size distribution of the particles (Figure 4).
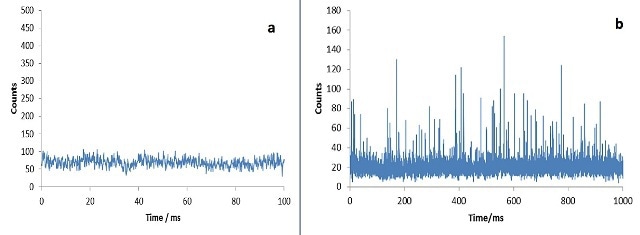
Figure 3. (a) Continous signal from dissolved ionic silver; (b) raw data of sample containing AgNPs.
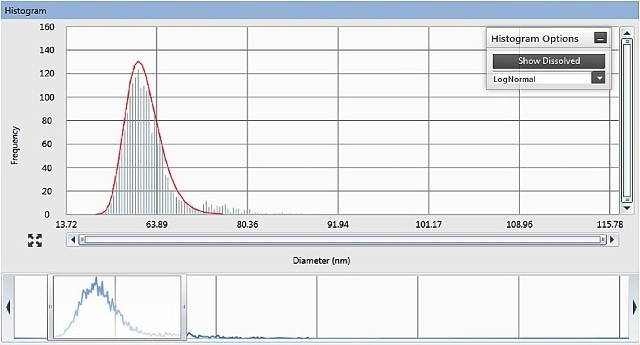
Figure 4. The Results panel of the Syngistix Nano Application Module for SP-ICP- MS, showing size distribution histogram and adjustable integration window at the bottom.
A PerkinElmer’s NexION® 350D ICP-MS running in Standard (no gas) mode and with the Syngistix Nano Application Module was used to make all SP-ICP-MS measurements under the instrumental conditions summarized in Table 1.
Table 1. Instrumental operating parameters and conditions
| Parameter |
Condition |
| Instrument |
NexION 350D ICP-MS in Standard Mode |
| Nebulizer |
ESI PFA Concentric |
| Spray Chamber |
Baffled Cyclonic, Glass |
| Injector |
2.0 mm id Quartz |
| Power |
1600 W |
| Aux Flow |
1.1 L/min |
| Neb Gas Flow |
1.05 L/min |
| Sample Uptake Rate |
0.4 mL/min |
| Silver Isotope |
107 AMU |
| Dwell Time |
50 µsec |
| Quad Settling Time |
Zero |
| Sampling Time |
120 sec |
Experimental Results
SP-ICP-MS allows for viewing the generated ICP-MS signal in real time during data acquisition. It is possible to review the acquired data in a variety of ways, with size data being graphically presented as a size distribution histogram. The size distribution histograms for AgNPs in Samples #1 and #2 are shown in Figures 5 and 6, indicating particle size distributions around 15 nm and 33 nm, respectively.
Tabulating the data in a list of scrolling results is also possible, showing data such as dissolved concentration, particle concentration, mean size, most frequent size, and particle counts for each sample.
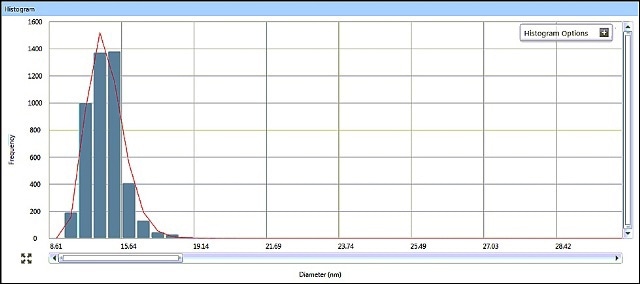
Figure 5. Sample #1 size distribution histogram from Syngistix Nano Application Module.
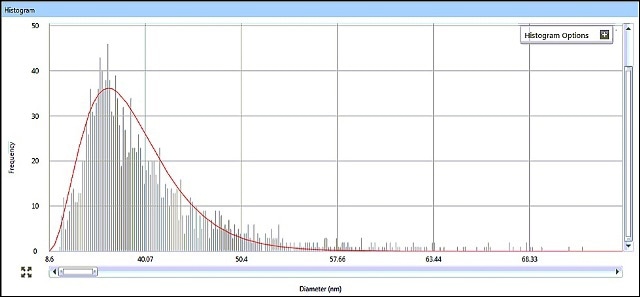
Figure 6. Sample #2 size distribution histogram from Syngistix Nano Aplication Module.
The SP-ICP-MS analysis results are summarized in Table 2. The Syngistix Nano Application Module not only provides the size distribution results, but also the dissolved and particle concentrations in the samples.
The Ted Pella™ 50 nm AgNP standard was used as control sample check. The most frequent size of 48 nm correlates well with the prescribed value of 50 nm, and the calculated particle concentration is in line with the manufacturer-reported value of 2.5 E+10 particles/mL.
Table 2. Results for the SP-ICP-MS analysis of AgNPs in dietary supplement samples
| Sample ID |
Mean Size (nm) |
Most Frequent Size (nm) |
Particle Concentration (particles/mL) |
Dissolved Concentration (mg/L) |
| Sample #1 |
14 |
14 |
3.0 E+10 |
9.5 |
| Sample #2 |
39 |
33 |
2.1 E+9 |
21.9 |
| Sample #3 |
53 |
59 |
2.7 E+10 |
48.1 |
| Ted Pella™ Ag 50 nm |
43 |
48 |
2.8 E+10 |
- |
Conclusion
The combination of PerkinElmer's Syngistix Nano Application Module and the NexION 350 ICP-MS’ superior ultra-fast data acquisition electronics enabled the measurement of AgNPs in three commercially available dietary supplements, determining particle size, concentration, composition, and size distribution in a single analysis. The quantitation and differentiation between the analyte’s dissolved ionic and particulate fractions can be efficiently performed through single particle ICP-MS.

This information has been sourced, reviewed and adapted from materials provided by PerkinElmer Inc.
For more information on this source, please visit PerkinElmer Inc.