Extracellular vesicles found in a wide range of eukaryotic and prokaryotic organisms are the subject of intense research in recent years. Commonly described as exosomes from the microvesicles or cell endosomes, these cell-derived vesicles play a major role in pathological and physiological processes. However, their characterization, functions, structure and cellular origin are still under debate in the research community.
With these studies providing indepth knowledge on the functions of extracellular vesicles on one side, it is also necessary to focus on the sample stability to ensure that the differences attribute to test conditions.
This article describes the applications of Nanoparticle Tracking Analysis (NTA) in the measurement of concentration and size of exosomes stored at ambient temperature and 4°C for nearly 5 days.
Overview of NTA
NTA is used for the extraction of size distribution of particles in liquid samples, using both Brownian motion and light scattering effect. When a laser beam is passed via the sample chamber, the light is scattered by the particles in suspension. The scattering of light can be viewed using a microscope with 20x magnification. The microscope is mounted with a camera that operates at nearly 30 frames per second (fps) and captures a video file of the particles based on Brownian motion in the field of view as shown in the Figure 1.
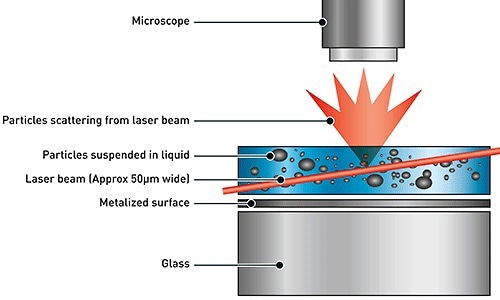
Figure 1. Schematic of the optical configuration used in NTA.
The particle movement is captured on each frame. The center of the observed particles are identified and traced by the proprietary NTA software which also measures the average distance moved by the particle in the x and y planes. Based on this value, the particle diffusion coefficient (Dt) can be determined. Therefore, using solvent viscosity η, sample temperature T and Dt, the sphere equivalent hydrodynamic diameter, d of the particles can be determined using the Equation 1 where KB is Boltzmann’s constant.
Dt = TKB/3pπηd
Figure 2 shows an example of size distribution profile created by NTA. The movement of particles is measured in a fixed field of view that is illuminated by an approximately 10µm deep beam. These values enable estimation of a scattering volume of the sample. A concentration estimation corresponding to particles per mL of sample can be achieved by measuring the particle concentration within the field of view and extrapolating to a larger volume.
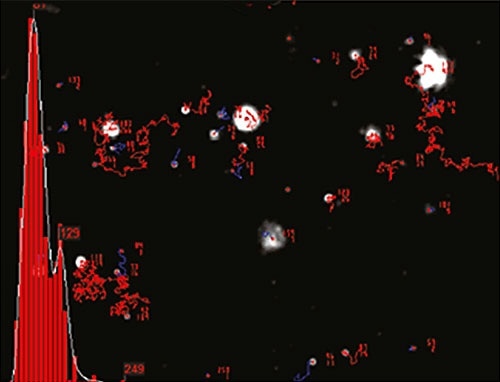
Figure 2. An example of the size distribution profile generated by NTA.
Materials and Method of Experiment
Equipment Used
- Two NanoSight LM10 HSB systems with a sCMOS camera and 405 nm laser
- NTA software 2.3.5.
Materials Required
- Lyophilized exosomes from human urine stored at 4°C
- Plasma stored at 4°C
- Phosphate buffered saline (PBS) stored at 4°C
Method
The exosomes obtained from human urine were suspended in 100 µL of PBS solution and mixed by means of pipetting. The mixture was further added with 900 µL of PBS and mixed by pipetting. The exosomes were then added to another tube consisting of 19mL of PBS followed by mixing through gentle inversion. 10 mL of this sample was transferred to a clean tube and stored at 4°C (exo4_U) until required. The remaining sample is stored at room temperature (exoRT_U). The plasma derived exosomes (exo4_P and exoRT_P) were also prepared in a same manner.
After preparation, the laser sample chamber is loaded with nearly 700µL of the exoRT_U sample through a 1 mL silicon oil free syringe. The sample chamber was then placed in the instrument. The image was adjusted by setting the camera level to 16 and bringing the particles into focus. Based on the camera histogram and the threshold settings provided in the Table 1, the contrast of the image was improved. Three 60 second videos were captured. Samples were measured at incubation times of 0, 60, 120, 180 and 300 minutes, for 5 days.
The exo4_U samples were measured by setting the camera level to 16, and the videos were captured as before at the incubation times given above. The exoRT_P and exo4_P samples, however, are measured in the same way as above, except that the camera level was adjusted to 13.
Table 1. Camera histogram threshold settings used when capturing videos of exosomes at various incubation times.
| TIME (mins) |
Urine-derived exosomes |
Plasma-derived exosomes |
| RT |
4°C |
RT |
4°C |
| Low |
High |
Low |
High |
Low |
High |
Low |
High |
| 0 |
195 |
2535 |
|
|
390 |
4420 |
|
|
| 60 |
195 |
5470 |
195 |
3120 |
390 |
4420 |
390 |
4420 |
| 120 |
195 |
2535 |
195 |
2080 |
390 |
4420 |
390 |
4420 |
| 180 |
260 |
2340 |
260 |
2340 |
390 |
4420 |
390 |
4420 |
| 300 |
195 |
2535 |
195 |
2535 |
390 |
4420 |
390 |
4420 |
| 1440 |
195 |
2535 |
195 |
3250 |
390 |
4420 |
390 |
4420 |
| 7220 |
195 |
3510 |
195 |
2535 |
0 |
6588 |
0 |
6588 |
Results and Discussion
Using the NanoSight LM10 instrument, measurement of the plasma and urine-derived exosomes can be performed to extract size distribution profiles. Figure 3a and 3b shows the data obtained at time zero for Plasma and Urine exosomes, respectively. The figure also displays a particle image that can be obtained by adjusting the camera histogram settings, ensuring improved contrast of particles to background.
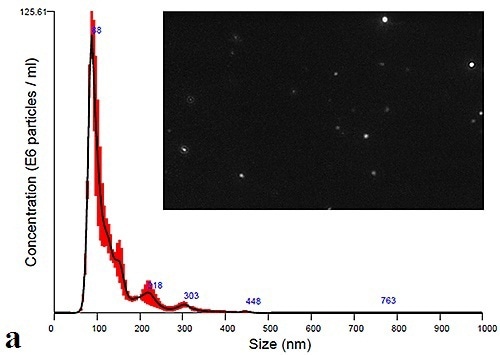
Figure 3a. Initial size distribution profiles and particle images for plasma- derives.
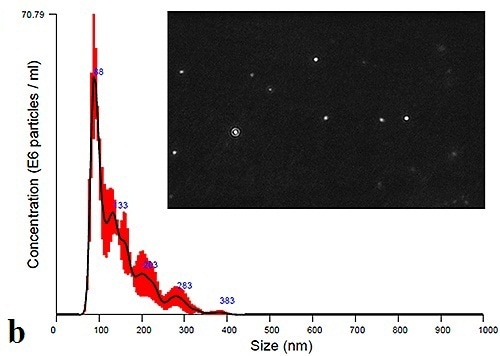
Figure 3b. Initial size distribution profiles and particle images for urine-derived exosomes.
The PBS-exosome suspensions were found to be polydispersed moderately, and the modal peaks were around 90 nm. Smaller peaks, however, were found to be around 140 nm, 200 nm and 300 nm. Figure 4 shows the modal size and concentration of exosome suspensions from both plasma and urine at room temperature or 4°C.
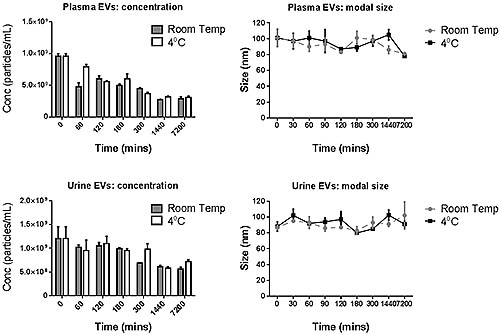
Figure 4. The modal size and concentration data for both plasma and urine- derived exosomes for various incubation times when stored at 4°C or at room temperature.
The data suggest that the manipulation of exosomes should be carried out at the earliest stage, and the moderate storage times can also have detrimental effect on the concentration measured.
Summary
It is evident from the above experiment that real time capture of images provides high resolution size distributions and concentration measurements which exhibit quantitative and qualitative information. The low refractive-index biological particles can be easily identified by using a high-sensitivity scientific CMOS camera and modification of the grey-scale of the image. NTA serves as an efficient alternative to other highly complex analytical methods such as Electron Microscopy.

This information has been sourced, reviewed and adapted from materials provided by Malvern Panalytical.
For more information please visit Malvern Panalytical.