While trying to differentiate a specific particle subset from within a complicated background, the ability to identify nanoparticle fluorescence is important. Fluorescent particles can be measured in terms of concentration and particle size in order to understand the nature of those particles.
Understanding nanoparticle toxicology in biological environments and the fate of drug delivery vectors are typical applications. Alternatively, fluorescent labeled antibodies can be used for specifically binding to target particles in a sample, offering a mechanism to detect specific particle populations in an unknown sample. This has implications in diagnostic applications like research into microvesicles and exosomes, where it is possible to detect and monitor specific markers while detecting diseases.
The NanoSight range of instruments offers nanoparticle tracking analysis (NTA), which is capable of functioning in light scatter mode, where all particles in a sample and visualized and measured. Alternately, instruments can function in fluorescence mode, where only fluorescently labeled particles are identified and measured.
In order to excite particles labeled with the right fluorophores, whose fluorescence can be measured using matched short or long-pass filters, the NanoSight system uses either a 405 nm (violet), 488 nm (blue) or 532 nm (green) laser source.
This article covers an experiment to establish a baseline in terms of the fluorescence limit of detection for a particular fluorophore.
The biotin-streptavidin interaction is popular as a very strong, non-covalent binding interaction, Kd ~10 mol/L. Each streptavidin molecule has four available sites for biotin binding, with one for each monomer unit, thus creating the quaternary structure.
This ratio was used for determining the highest possible number of fluorescent streptavidin molecules that each gold nanoparticle could have attached to its surface (Figure 1).

Figure 1. Graphic showing the formation of the strepatividn-biotin complex and it's binding to a gold nanoparticle.
Materials Used
The researchers procured 80 nm spherical gold nanoparticles with biotin bound to the surface (GNP) from NanoPartz (product code C11-80-TB-50), with a defined biotin/particle density. The particle size was measured using TEM and DLS, and was supplied in a 9.4 x 10¹¹ particles/mL concentration.
Streptavidin (F*) with a fluorescent label created with with NorthernLights™ 557 dye was procured from R&D Systems (product code NL999) at a 1 mg/mL (~1016 particles/mL) stock concentration. The absorption peak and the emission peak of the dye are 557 nm and 574 nm respectively.
Methods Used
Data collection was performed using a NanoSight LM10 system fitted with a 532 nm LM14 laser module, high sensitivity (HS) sCOMS camera, 565 nm long pass emission filter, and NTA syringe pump. Data analysis was performed using NTA3.1 software.
All dilutions were performed in 0.02 µm filtered PBS. First, the right amount of GNP concentration for NTA was prepared using serial dilution. By dilution of the original sample by a factor of 100 in PBS, the GNP working stock was prepared.
In order to attain an overall sample volume between 1200-2000 µL and NP concentration of ~4 x10 particles/mL, aliquots of this stock along with F* were taken and diluted in PBS.
Sample preparation was performed in such a way that F* was added at the ratio 0-1000000 F* per 1 GNP and mixed by pipetting. From initial experiments, and the knowledge that a stable biotin-streptavidin complex is rapidly formed, each sample was permitted to incubate for 30 minutes in the dark before performing measurements at room temperature.
NTA was then deployed to determine the total concentration of particles under fluorescence and scatter. Camera settings were kept consistent for measurement types – one for fluorescent measurements and another for scatter measurements.
To make sure that analysis is performed under slow and steady flow conditions in both fluorescence and scatter modes, allowing direct comparison of the data from both the modes, the NTA syringe pump was used.
For each sample, in both the scatter and fluorescence modes, three videos of 60 s each were captured. Table 1 shows the several controls measured.
Table 1. Controls measured in both scatter mode and fluorescence mode, and their significance.
| Sample |
Scatter Mode |
Fluorescence Mode |
| Biotin-gold nanoparticles |
Confirmation of concentration |
No signal expected |
| Fluorescent streptavidin |
Checking for aggregates |
Checking for aggregates |
| Biotin-Gold-nonfluorescent streptavidin |
Checking for aggregates |
No signal expected |
Assumptions and Caveats
The biotin supplied with the nanoparticles was defined as being 2 molecules per nanometer square of the surface of the particle. For a spherical particle measuring 80 nm, the biotin amount was determined as 40,000 biotin molecules per particle.
There are four biotin binding sites in a streptavidin molecule, hence if all biotin molecules on each gold particle are bound, approximately 10,000 streptavidin molecules would be need for fully covering the particle.
While incubating the nanoparticles with F*, the assumption is that F* is homogenously distributed over all the existing nanoparticles in a way that all particles have bound the same number of F* molecules.
Results
Under a steady flow of 50 a.u, gold nanoparticles were initially measured under both fluorescence and scatter modes. Figure 2 shows the NTA size distribution profile of the particles.
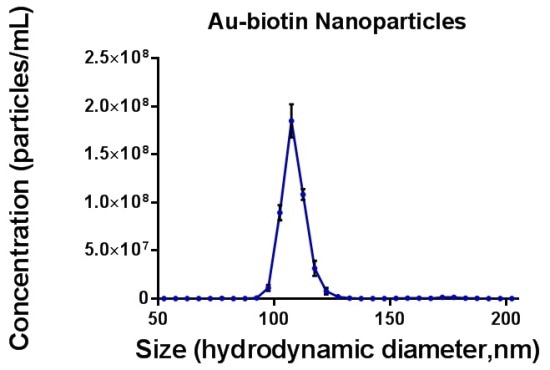
Figure 2. Size distribution profile of gold-biotin nanoparticles measured under a constant flow of 50. Only data from light scatter mode are shown as the unlabelled particles did not exhibit a fluorescent signal.
In order to determine the right incubation time, a preliminary time course study was performed. Incubation of nanoparticles was performed with an equivalent of approximately 1000 F* molecules per nanoparticle, and these were incubated at room temperature and in the dark for different time periods. As Table 2 shows, the labeling was instant, and 30-minute incubation was chosen to ensure that the incubation for binding biotin-streptavidin was complete.
Table 2. Incubation time labelling efficiency data from biotin-gold NP labelled with F* in ratio of approximately 1000F* molecules to one gold NP.
| Time from labelling [minutes] |
3 |
20 |
35 |
60 |
150 |
| Fluorescence efficiency [%] |
62 |
67 |
64 |
67 |
69 |
While determining various ratios of F* per gold nanoparticle, the total population percentage determined in fluorescent mode, increased with increasing F* ratios till “100%coverage” was attained. Figure 3 shows selected ratio data.
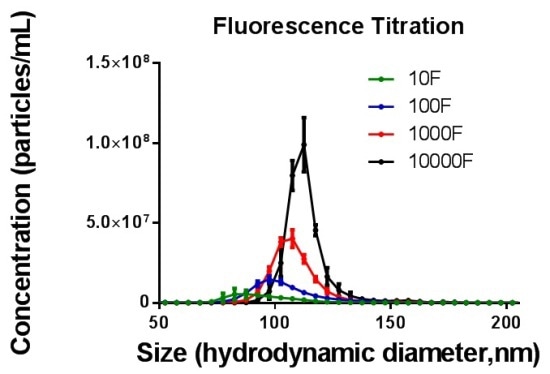
Figure 3. Distribution data for 10F* per 1GNP (green), 100F* per 1GNP (blue), 1000F* per 1GNP (red) and 10000F* per 1GNP (black) measured in fluorescence mode.
It was observed that the number of particles measured in fluorescence mode decreased with increasing fluorescence amounts while increasing the ratio of F* beyond "100% coverage". It was tough to visualize and monitor the particles with the NTA software as the image background became brighter. The total proportion of fluorescently labeled particles determined in fluorescence mode NTA increased up to "100% coverage", while the addition of further fluorescence to the sample resulted in a reduction in the number of particles measured. (Figure 4)
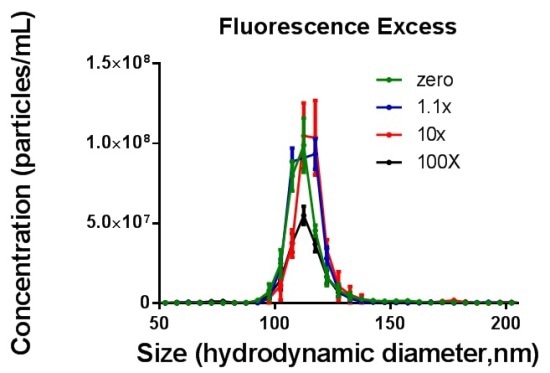
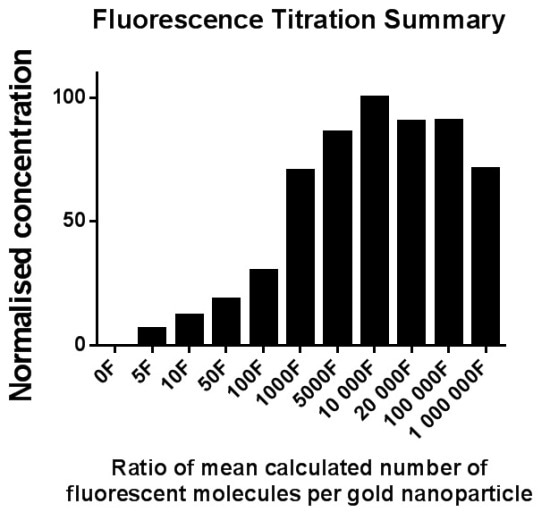
Figure 4. Top - Size distribution data for 10000F* per 1GNP (zero excess fluorophore, green), 11000F per 1GNP (1.1x excess fluorophore, blue), 100000F* per 1GNP (10x excess fluorophore, red) and 1000000F* per 1GNP (100x excess fluorophore, black) measured in fluorescence mode. Bottom - Overall summary of fluorescently labelled GNP measured in fluorescence mode of NTA. The x axis shows the ratio of fluorescence molecules per GNP (Data combined from three separate assays).
Conclusion
This study covers NTA sensitivity in terms of determining fluorescently labeled particles using standard materials with known affinity strengths. It makes several assumptions (gold particle surface area, biotin coverage, complete streptavidin binding, homogeneous sample incubations), but shows that with an equivalence of five fluorescent streptavidin molecules per gold nanoparticle, certain gold particles are identified as being fluorescently labeled. The reasons why 100% recovery is not measured at this level are:
- These particles appear dimmer than those having greater loadings hence they may be observed only in a smaller scattering volume.
- Uneven particle loading at the 5F/particle loading level, certain particles may have 10F attached while others may have 0F attached. It is possible that only the brighter particles can be detected.
- Photo bleaching will have a higher effect on particles having a lower fluorophore number than particles with a higher fluorophore number.
It was observed in this example that when compared to gold nanoparticles with 600 F or more that were very bright, the particles with 5F* per gold nanoparticle were very dim, and it was a challenge to visualize and focus these particles in fluorescence mode. Furthermore, increasing the fluorescent molecule ratio at a level higher than 10% above a theoretical "100% coverage" caused a raised unbound fluorescence background.
Particle visualization and tracking becomes very tough with this raised background, and as there is an increase in fluorescence excess, there is a decrease in the number of particles measured.
Fluorescence measurement efficiency with NTA is impacted if there are too many or too few fluorophore particles in the sample. Depending on the particle size, the laser wavelength, the fluorophore used and binding efficiency, a recommended minimum number of 10 to 20 organic fluorophore molecules per nanoparticle is required for successfully visualizing, regulating and measuring labeled particles in fluorescence mode using NTA.

This information has been sourced, reviewed and adapted from materials provided by Malvern Panalytical.
For more information please visit Malvern Panalytical.