The number of consumer products using nanomaterials is continuing to rise, raising significant concerns about their potential impact on the environment. In this regard, finding appropriate measures for their analysis presents a major issue. This article reviews the application of nanoparticle tracking analysis (NTA) to overcome this problem.
Overview of Nanoparticle Tracking Analysis
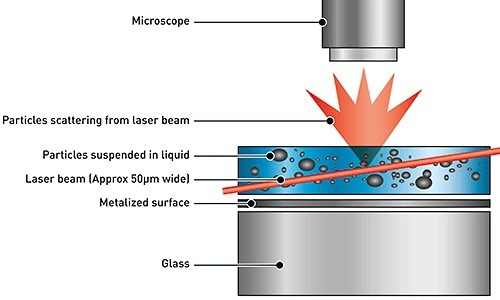
In order to acquire the particle size distribution of samples in liquid suspension, the NTA method uses the properties of both Brownian motion and light scattering. When a laser beam passes through the sample chamber, the particles in suspension that fall in the path of the laser beam disperse light in such a way that they can be viewed easily through a 20x magnification microscope. A camera is also mounted on this microscope, operating at about 30 fps and recording a video file of the particles as they move under Brownian motion inside the field of view of 100 x 80 x 10 µm, as shown in Figure 1.

Figure 1. Schematic of the optical configuration used in NTA.
The particles’ movement is recorded on a frame-by-frame basis. At the same time, the NTA software detects and monitors the center of individual particles that were observed, and also measures the standard distance moved by individual particles in the direction of x and y planes. The value thus obtained makes it possible to determine the particle diffusion coefficient (Dt) . From this, if the solvent viscosity η and sample temperature T are known, it is possible to identify the sphere-equivalent hydrodynamic diameter (d) of the particles using the following Stokes-Einstein equation:

where KB is Boltzmann's constant.
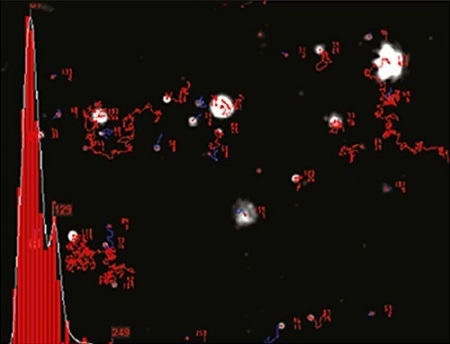
The NTA method sizes each particle individually, regardless of the others. Figure 2 shows an example of the size distribution profile produced by NTA. Moreover, the movement of the particles is determined within the camera’s fixed field of view that measures about 100 x 80 µm.

Figure 2. An example of the size distribution profile generated by NTA. The modal size for this sample is found to be approximately 70 nm, with larger sized particles also present.
These figures make it possible to estimate the sample’s scattering volume. By determining the particles within this field of view as well as extrapolating to a larger volume, a concentration estimation can be obtained with respect to particles per mL for any specified size class or a total concentration.
Monitoring Nanoparticle Exposure
Environmental monitoring programs and standardized techniques are needed to analyze anthropogenic nanoparticles. Such measures would help in evaluating the risks posed to biological species as a result of possible nanoparticle exposure. NTA is one of the few methods that can handle the measurement of particle size distribution within the nano-size region. It has now become an ASTM method for studying particle size distribution of nanomaterials in suspension.
Nanoparticles and their analysis have attracted significant attention. These particles are already being used in a number of consumer products such as food, cosmetics, and food packaging; however, their identification and measurement in food represent a difficult challenge. Based on these factors, the European Commission published its proposal on the definition of 'nanomaterial' in October 2011. This will have a major impact in numerous areas of legislation; for instance the European Cosmetic Products Regulation, where the present definitions of nanomaterials will be discussed with regards to how they should be adapted in view of this recent definition. This recent definition calls for measuring the number-based particle size distribution in the size range of 1100 nm of all particles present in the sample, irrespective of whether they are part of an aggregate/agglomerate or exist in a free state.
Methods for determining nanoparticles size distribution in consumer products and food were subsequently reviewed by Calzolai et al. (2012). When the NTA technique was compared with other similar techniques, they acknowledged that the former method was effective in resolving the innate drawbacks of the static light scattering and DLS methods when confronted with a combination of similarly sized particles. The NTA method had several key benefits such as high sensitivity and low instrument cost. The high levels of sensitivity can detect nanoparticles at concentrations down to 106 particle/cm3.
However, one major limitation of the NTA technique is that it fails to identify nanoparticles measuring less than 10 to 20 nm, which means that it did not fully satisfy the prerequisites of the EU definition and, furthermore, the technique would require an expert operator.
Treatment of Wastes and Contamination
This section elucidates certain examples of the application of NTA for concentration and sizing measurement of nanoparticles in the development of monitoring procedures, as might be applied to manufacturing processes and industrial products. In this regard, Sachse et al. (2012) analyzed the influence of nanoclay on dust production during the drilling of polymer nanocomposites, using the NTA technique to track particle size quantity and distribution. The effect of nanoclay on mechanical drilling of PA6 composites, with respect to dust production, showed that with more particles being produced during drilling of the nanocomposites, these particles tend to deposit in a shorter period of time. Likewise, Njuguna et al. (2011) performed structural testing to explore the nanoparticles produced from nanofiller reinforced polymer nanocomposites.
Kunniger et al. (2010) studied the outcomes for functionality and the aquatic environment of the discharge of traditional and nano-sized biocides from coated wooden facades during weathering. Cabot et al. (2012) utilized NTA to track transformations in tobacco smoke particle size when quantified across range of varied time points. Wilkinson et al. (2011) used NTA and DLS techniques to study the health effects of automotive particulate pollution and monitor aggregation of particles in cell growth media.
A novel SAE Standard, spanning military engine oils ideal for preservation and lubrication of reciprocating internal combustion engines in systems used in tactical and combat service, has been proposed recently. Here, the NTA technique was utilized to ascertain protocols to determine the size distribution of soot agglomerates in used automotive lubricant oils. The SAE Standard is equivalent to the MIL-L-21260 standard. Peetsch and Epple (2011) used SEM, DLS, NTA, X-ray powder diffraction (XRD), atomic absorption spectroscopy (AAS), energy-dispersive X-ray spectroscopy (EDX), elemental analysis, and thermogravimetric analysis (TG) to characterize the solid components of a mouthwash and three desensitizing toothpastes.
Chen et al. (2012) studied and developed an easy test for the characterization and initial toxicity assay of nano-titanium dioxide additive in chewing gum coated with sugar. Using NTA, results revealed that there are far more food products containing nano-TiO2 than currently known. Likewise, using the NTA method, van Landuyt et al. (2013) demonstrated the presence of nanoscale particles in dental abrasives, and the possibility of inhaling nano-sized dust particles by both patients and dental employees during abrasive processes.
Having recognized the fact that no standard technique exists for assessing the efficiency of personal protective equipment against nanoparticles, Dolez et al. (2011) utilized NTA and other methods to establish the rate of penetration of nanoparticles through protective gloves, under conditions replicating interaction between gloves and nanoparticles. Textile materials containing engineered nanoparticles, or ENPs, exhibited superior properties as they are protective, water resistant, antimicrobial and antibacterial. The importance and benefits of ENPs is well known in the textile industry, making them the subject of considerable patent activity.
With the growing number of nanomaterial-based consumer products, their potential impact on the environment is a major concern. To evaluate the effluent from a silver nanowashing machine, Farkas et al. (2011) employed TEM and inductive coupled mass spectrometry (ICP-MS) to validate the presence of standard 10 nm silver nanoparticles, but also used NTA to establish the fact that 60 to 100 nm particles also existed. The effluent was found to have a major impact on a bacterial community as its abundance was reduced upon exposure to the nanowash water. They proposed that if AgNPs-producing washing machines become a standard feature in all households in the future, large amounts of AgNPs will be present in wastewater, which could be released into the environment.
Hendraningrat et al. (2012a) studied innovative methods for enhanced oil recovery (EOR) by carrying out a glass micromodel experimental analysis of hydrophilic nanoparticles retention for EOR, wherein NTA was utilized to specify particles in both the effluent and influent in a glass micromodel. Hendraningrat and his colleagues performed additional analyses in this area, wherein NTA was used to study the concentration, size and size distribution of nanoscale particles employed in the area of EOR.
Filtration
The NTA method not only produces high resolution particle size distribution data, but also generates nanoparticle concentration data, thus making it suitable for testing filters and filtration processes. Ling et al. (2011) have employed the NTA technique to determine upstream and downstream particle (50 - 500 nm) concentration of the filter to establish the filtration efficiency of the Nucleopore® filter for use in the disinfection and purification of drinking water, in addition to the removal of NPs in pure chemicals used in the industries. It was shown that NTA measurements were consistent within a certain concentration limit of approximately 108-1010 particles/cm, indicating that experimental outcomes are similar to previously published data acquired using an aerosolization technique. This confirmed the capability of the NTA method.
Schulz (2012) carried out a sub-micron particle analysis to define fouling in tertiary membrane filtration, wherein he tested a mixture of coagulation, pre-ozonation, and subsequent low-pressure membrane filtration as an alternative for tertiary wastewater treatment. Here, NTA facilitated a consistent and reproducible detection of the colloid content in treated domestic wastewaters. The study results showed that coagulation and ozonation appeared to reduce the content of < 200 nm colloids by forming larger agglomerates, thereby resulting in a better water filterability. The use of both treatments demonstrates synergetic effects and leads to an additional reduction of the particle content and the overall fouling resistance.
Luechinger et al. (2010) elucidated a facile and widely applicable technique to prepare nanoporous silver films from 0.5-5 µm to 30-300 nm, utilizing soluble salt nanoparticles, and testing them with filtration of aqueous dispersions of carbon nanoparticles at a filtration efficiency of greater than 99.6%. In electrostatic interactions of proteins and polysaccharides using sodium alginate (Na-Alginate) and bovine serum albumin (BSA) to demonstrate the contribution of this type of non-covalent network to membrane fouling, the NTA method was utilized to show that formation of soluble complex is controlled by lowering zeta-potential to allow a link between positively charged micro-regions on the protein and negatively charged carboxyl groups on the alginate (Neemann et al. (2013)).
Holan et al. (2013a), during the development of a recirculating aquaculture system wherein collection of suspended colloids and solids can be prevented by integrating a membrane filtration unit within the system, utilized the NTA technique to detect how the feeding regime impacted the performance of membrane and the fouling phenomena induced by submicron and dissolved colloidal particles in the system, and how the membrane affected the quality of water and particle characterization. Thus, Holan et al. (2013b) demonstrated that there is huge potential in using a membrane filtration solution in aquaculture recycling systems.
Conclusion
The NTA technique helps in measuring the impact of nanomaterial wastes and contaminants in the environment. In comparison, other techniques were found to be less informative. However, one major drawback of this method is that it is not capable of detecting nanoparticles less than 10 to 20 nm, which means it does not meet the complete requirements of the EU definition. Despite this fact, the NTA has become an ASTM method for measuring nanoparticles size distribution in food and consumer products and testing of filters and filtration processes.

This information has been sourced, reviewed and adapted from materials provided by Malvern Panalytical.
For more information please visit Malvern Panalytical.