For any DLS system, its performance is based on the sample, for instance, the upper size limit may be > 5 μm for an emulsion, but < 1 μm for a high density particle since the analysis loses accuracy upon onset of sedimentation. The upper concentration limit may be >40 vol. % for particles < 10 nm, but closer to 1% for particles ~ 1μm.
Although results will be generated by the DLS system for each analysis, that does not guarantee every result is equally accurate. For the Nicomp DLS systems, the lower size and concentration limits depend on both sample and configuration of the system. It is recommended to have a higher power laser and high sensitivity APD detector for low concentration measurements of smaller particles. This article discusses the ability of the the Nicomp DLS system to perform low concentration measurements of lysozyme.
Experimental Procedure
Lysozyme (Figure 1), a single chain polypeptide, consists of 129 amino acids cross-linked with four disulfide bridges. The molecular weight of this protein is 14,307Da with a DLS-measured particle size of roughly 3.6nm.
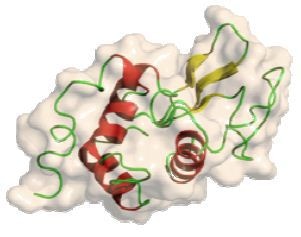
Figure 1. Lysozyme protein
Previous experience suggests the monomer form of lysozyme shows high stability at low pH values close to pH2.2. A KCl buffer at pH 2.2 was prepared by first dissolving 14.91g of KCl in 100mL filtered DI water to create a 1.0.2M KCl solution. This was followed by adding 8.58ml concentrated HCl into 491.4ml water to create 0.2M HCl solution. The next step was the addition of 50mL of the 0.2M KCl solution into a 200mL clean bottle, followed by gradual addition of 7.8mL of the 0.2M HCL into the KCL solution. The total volume of 200ml was finally obtained by adding filtered DI water. A 0.2µm syringe filter was always used to filter this buffer solution for any subsequent steps.
The lysozyme used purchased from Sigma Aldrich, catalog number L6876, lysozyme from chicken egg while supplied as a lyophilized powder. The protein content by UV absorbance of the lysozyme used was 90% and buffer salts, such as sodium chloride and sodium acetate, were the remaining constituents. Hence, all reported concentrations in this article are slightly less than by a factor of roughly 10% as no concentration corrections were carried out. The base 10 mg/mL lysozyme sample was prepared by adding 0.1g lysozyme powder to 100mL filtered buffer solution and mixed for 1h. This was then diluted at a ratio of 10:1 with filtered buffer solution to prepare 1mg/mL concentration. The resulting sample was then diluted at a ratio of 10:1 with filtered buffer to form the 0.1mg/mL concentration sample.
The Nicomp DLS system is capable of measuring lysozyme down to a concentration of 0.1mg/mL, which is the lower concentration limit for the instrument. This experiment used an off the shelf Nicomp 380 DLS system coupled to an APD detector and 658nm, 50mW laser. All measurements were performed at 90º. Figure 2 shows the system setup dialog box settings, and Figure 3 depicts the Particle Sizing Control Menu settings.
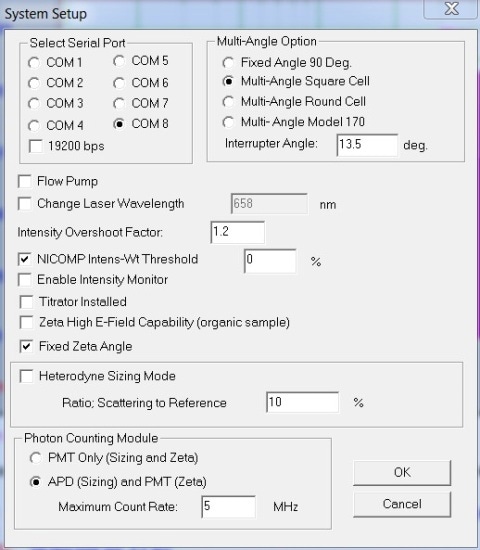
Figure 2. System Setup settings
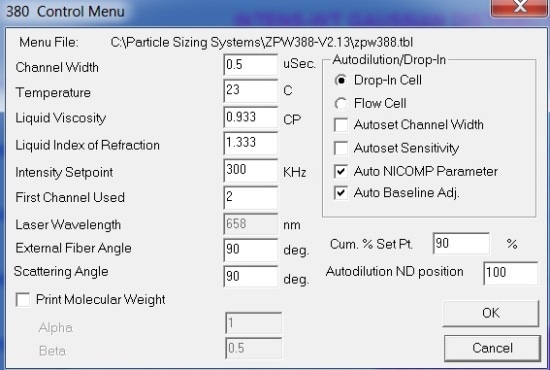
Figure 3. Control menu settings
Figure 4 presents the Auto Print/ Save Menu dialog box settings.
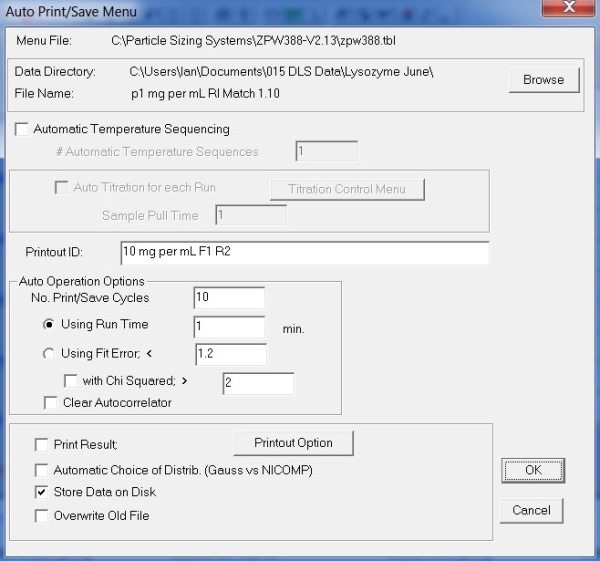
Figure 4. Auto Print/ Save Menu settings
Experimental Results
The 10mg/mL lysozyme sample was filtered through a 0.2µm syringe filter and then introduced into a clean square glass cuvette. Using the aforementioned settings, the sample analysis was performed. Figure 5 shows the experimental results acquired.
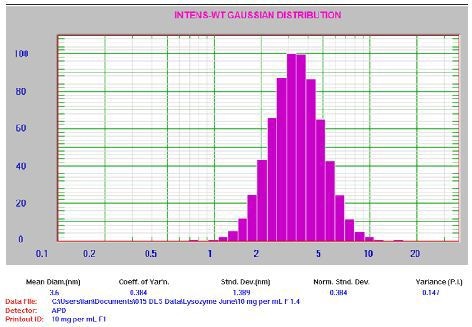
Figure 5. 10mg/mL lysozyme result. For clarification: Mean Diam = 3.6 nm, Std Dev = 1.389nm, PI = 0.147.
It is to be noted that the PI value is small as anticipated for a well- prepared sample with count rate ~160 kcps. The 1mg/mL lysozyme sample was filtered through a 0.2µm syringe filter and then introduced into a clean square glass cuvette. The next step was aggregate separation by centrifuging the cuvette at 8000rpm for 10min. Then, the sample analysis was performed using the aforementioned settings. Figure 6 illustrates the corresponding results.
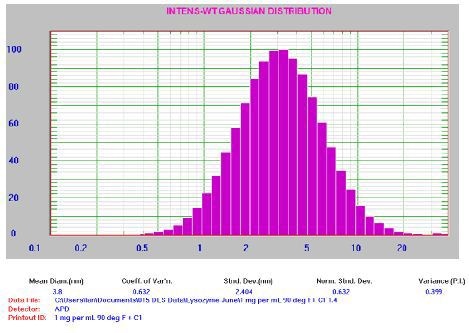
Figure 6. 1.0mg/mL lysozyme result. For clarification: Mean Diam = 3.8nm, Std Dev = 2.404nm, PI = 0.399
It should be noted that the PI value is higher than anticipated for a well-prepared sample, representing the presence of possible aggregates. This is typical for a sample at low count rate (~30kcps). Now, the 0.1mg/mL lysozyme sample was filtered through the 0.2µm syringe filter and introduced into a clean round glass cuvette. This was followed by centrifuging the cuvette at 8000rpm for 10min for aggregate separation. The next was placing the cuvette in a square cell consisting of oil with matching refractive index (RI), which enhanced the reproducibility of the lowest concentration measurements. Using the instrument settings, the sample analysis was performed. The corresponding results are reported in Figure 7.
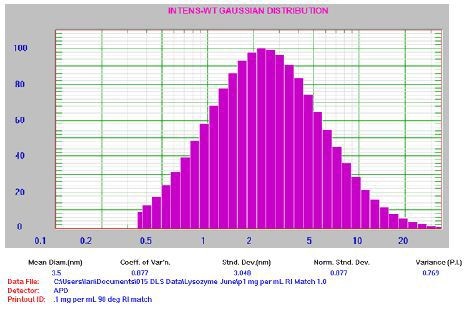
Figure 7. 0.1mg/mL lysozyme results. For clarification: Mean Diam = 3.5nm, Std Dev = 3.048nm, PI = 0.769.
It is important to note that the PI value is greater than predicted for a well-prepared sample, implying the presence of possible aggregates. This is typical for a sample at low count rate (~19kcps). The results showed the advantage of using the RI matching cell to enhance the count rate for the lowest concentration experiments. The repeatability of the instrument was assessed by measuring the 0.1mg/mL sample multiple times (Figure 8).
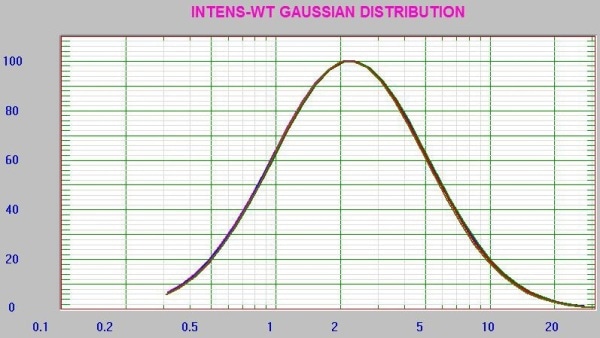
Figure 8. Nine consecutive results at 0.1mg/mL concentration lysozyme
Conclusion
All results presented in this article are in intensity distribution by applying the Gaussian distribution results, and no other changes/conversions were utilized to produce these results. From the results, it is evident that the Nicomp DLS system can measure lysozyme at the specified concentration of 0.1mg/mL.

This information has been sourced, reviewed and adapted from materials provided by Entegris
For more information on this source, please visit Entegris