The dramatic growth in production and increased utilization of engineered nanoparticles (ENPs) have become a reason for worry and uncertainty with regard to their introduction into the environment and the probable harm to terrestrial and aquatic species. The ENPs are often chosen for use in different products due to their characteristic properties, such as high reactivity, high specific surface area, and small size.
The most common nanoparticles used in consumer products are silver (Ag) nanoparticles. This is because of their antimicrobial properties. It is a known fact that Ag ENPs will enter into the environment, so a technique for fast and precise detection and characterization of these ENPs in different environmental matrices is required. Research illustrating the potential for successful characterization of Ag ENPs in different biological media and water samples that might be exposed to environmental Ag ENPs has already been carried out.
Wastewaters are the major source for environmental release of these ENPs, so such complex matrices should be analyzed for the presence of Ag ENPs. The analysis of ENPs can be difficult due to the variety and complexity of these wastewater matrices. This article analyzes the capability of Single Particle ICP-MS (SP-ICP-MS) in characterizing Ag NPs contained in a dissolved organic solution including alginate, which is a common wastewater component, and two other wastewater matrices: effluent and mixed liquor.
Experimental Procedure
Samples and Sample Preparation
The water samples were obtained from a wastewater treatment plant close to Montreal, Quebec, Canada. Both mixed liquor from the secondary aeration tank and effluent wastewater from the secondary settling tank were collected in acid-washed, dark glass bottles and sealed. Effluent wastewater is the final processed wastewater released from the treatment plant into the river. Mixed liquor is the wastewater that exits the aeration tank, following the biological treatment, and reaches the secondary settling tank for sedimentation of the suspended solids. Consequently, the mixed liquor contains dissolved carbon content and suspended solids at relatively higher levels when compared with the effluent wastewater.
Alginate is a polysaccharide present in wastewaters at ppm levels and includes the dissolved organic carbon fraction of wastewaters. Alginate solution formed by deionizing alginic acid sodium salt from brown algae (Sigma-Aldrich, St. Louis, Missouri, USA) at 6 ppm in water, shaking end-over-end for an hour, was taken as a known surrogate/control in comparison with the wastewater samples.
The Ag ENPs were capped with polyvinylpyrrolidone (PVP) having a mean diameter of 67.8 ± 7.6 nm, which was determined by transmission electron microscopy (TEM) (nanoComposix Inc., San Diego, California, USA). The capped Ag ENPs were spiked into 10mL of all the samples at a concentration of 10 ppb (5 million particles/mL). Then the samples were diluted to about 10-1000x using deionized water. The diluted samples were then sonicated for 5 minutes before the analysis. All samples were produced in triplicate.
Instrumental Conditions
A PerkinElmer NexION 300D/350D ICP-MS working in SP-ICP-MS mode with the Syngistix Nano Application Software Module was used for all of the analysis. Table 1 illustrates the instrumental parameters in determining a transport efficiency of 8.3%.
Table 1. NexION 300D/350D ICP-MS instrumental parameters
| Parameter |
Value |
| Sample Uptake Rate |
0.3 mL/min |
| Nebulizer |
Glass Concentric |
| Spray Chamber |
Glass Cyclonic |
| RF Power |
1600 W |
| Analyte |
Ag107 |
| Analysis Time |
100 sec |
| Dwell Time |
100 µsec |
Results and Discussion
The Ag ENPs were added to deionized water at a concentration of 0.1 ppb (50,000 particles/mL) to determine the precision of SP-ICP-MS. The mean size of the Ag ENPs and their concentration measured by the SP-ICP-MS were 63.2 ± 0.2 nm and 53,758 ± 1363 particles/mL, respectively, which was in good agreement with the TEM measurements, validating the measurement accuracy. The values and the standard deviations are taken from the mean of the three replicate analysis.
Subsequently, the Ag ENPs in a 6 ppm alginate solution were measured. Figure 1 illustrates the Ag particle size distribution at 0.1 ppb (50,000 particles/mL), which is in accordance with a mean particle size of 66.1 ± 0.1 nm, at a concentration of 52,302 ± 2102 particles/mL. The agreement between the TEM-determined and measured particle sizes demonstrates that the presence of the alginate matrix does not impact the accuracy of measurements.
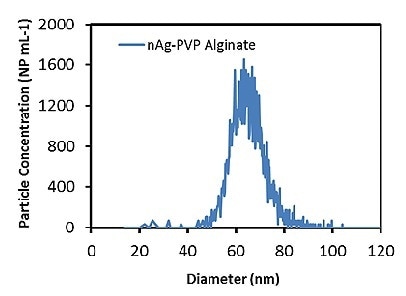
Figure 1. Measured Ag particle size distribution in 6ppm alginate solution.
After evaluating the accuracy of the process in the alginate solution, measurements were carried out on the mixed liquor and effluent wastewater samples. Initially, the total Ag concentration in both the wastewater samples was measured to be 25-40 ppt, a level that should not hinder the determination of Ag ENPs. The measured particle size distributions for the effluent wastewater and the mixed liquor are illustrated in Figures 2 and 3, respectively.
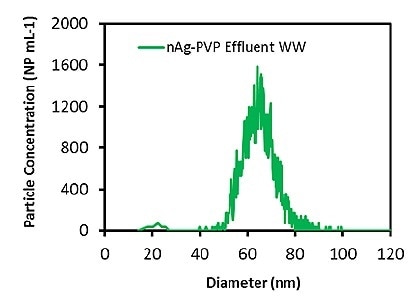
Figure 2. Measured Ag particle size distribution in effluent wastewater diluted 1000 times.
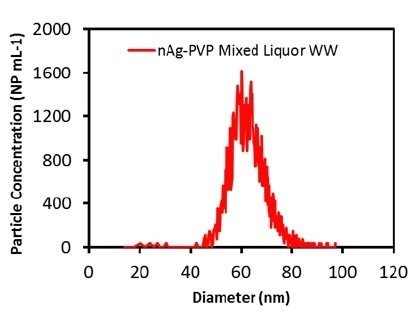
Figure 3. Measured Ag particle size distribution in mixed liquor wastewater diluted 1000 times.
The samples were diluted to 100x before the analysis. Table 2 presents the measured particle concentrations and particle sizes. Once more, the mean particle size was in good agreement with the attested value, and the particle concentration was nearly equal to the calculated value, which shows that both the wastewater matrices do not impact the measurement. These results demonstrate that Ag ENPs in wastewater samples can be successfully measured.
Table 2. Results from Analysis of Wastewater Samples Spiked with Ag NPs.
| Sample |
Mean Particle Size (nm) |
Spiked Particle Conc. (particles/mL) |
Measured Particle Conc. (particles/mL) |
| Effluent Wastewater |
66.3 ± 0.2 |
50,000 |
54,691 ± 1185 |
| Mixed Liquor Wastewater |
63.7 ± 0.4 |
50,000 |
53,123 ± 1216 |
The detection limits for the Ag particle size as well as concentrations in the wastewaters were established. To determine particle size detection limits, the diluted samples were analyzed without adding Ag ENPs. The detection limit was established by running the unspiked wastewater matrices and observing the particle size that correlated with the smallest peak recorded by the Syngistix Nano Application Module. The detection limit for the mixed liquor is approximately, 12 nm, while it is approximately 18 nm for the effluent wastewater.
To determine the lowest detectable concentration of Ag ENPs, they were spiked into deionized water and diluted a number of times. Then, the measured particle concentration was recorded for each of the concentrations. The spiked particle concentration was taken to be the particle concentration detection limit, and it was noted that there was no change in the measured concentration upon dilution of the sample. The Ag ENP particle concentration detection limit in this research was determined as 25 ppt (12,500 particles/mL). As the wastewater matrices did not impact the results, the detection limit was measured only in deionized water.
Conclusion
This research has demonstrated the capability of SP-ICP-MS to precisely detect and measure Ag nanoparticles in three disparate wastewater samples. Even though wastewater matrices are complex, they do not hinder the efficiency of the SP-ICP-MS in precisely measuring the nanoparticles size and concentration.

This information has been sourced, reviewed and adapted from materials provided by PerkinElmer Inc.
For more information on this source, please visit PerkinElmer Inc.