Carbon nanotubes (CNTs) have attracted a great deal of attention in the emerging field of nanotechnology and nanoscience. This is due to their special electronic and mechanical properties for a wide field of prospective applications. CNTs are part of a group of synthetic carbon allotropes and are defined by a complex network of sp2 hybridized carbon atoms. As a result, the 1D CNTs can be placed between the 2D relative graphene and their zero dimensional relatives, fullerenes.
In 1991, Iijima initially described the nanotubes’ structure as helical microtubules of graphitic carbon, and used an arc discharge evaporation process to produce the new material. This process was originally designed for fullerene production.
At a theoretical level CNTs are built by rolling up a sheet of graphene inside a cylinder, ensuring that the hexagonal rings are seamlessly joined together. Depending how the graphene sheet is rolled up, which is defined by their chirality and the (n,m)-indices shown in Figure 2, it is possible to construct a large diversity of single-walled carbon nanotube (SWCNT) structures. These structures vary in diameter, length, and roll-up angle, which define the direction of the hexagonal carbon rings in the honeycomb network corresponding to the nanotube axis. CNTs also have unique electronic properties, as they possess semiconducting or metallic behavior based on the (n,m)-indices.
In the science of CNTs, major obstacles like diameter, length, the inherently low polydispersity, and solubility with regard to electronic type, as well as controlled production and purification, have to be resolved to exploit their huge potential in industrial applications. Nevertheless, a wide range of proof of principle devices has been designed, because the functionalization of CNTs enabled their processing, dispersion, and isolation. Metallic SWCNTs, for instance, are used as conductive coatings for flexible displays, touch screens, thin film photovoltaics, printable electronics, nanowires, supercapacitors, and transparent electrodes, thanks to their remarkable current carrying capacities as well as the ballistic conductivity along the axis of the CNT. The semiconducting SWCNTs are used in sensing, switching, field effect transistors, etc. CNTs are suitable for reinforcing polymers due to their unique stiffness, high aspect ratio, and bending strength.
Use of UV/Vis/NIR Spectroscopy
In addition to the complications in functionalizing and processing SWCNTs, scientists have also found it difficult to look for SWCNT characterization methods that are reliable and allow a comprehensive analysis of processed and unmodified nanotube samples. Incidentally, UV/Vis/NIR absorption spectroscopy is a robust tool in the characterization of SWCNTs and makes it easy to access data related to SWCNT’s electronic and physical properties through an economical and readily available method.
In the case of absorption spectroscopy, the SWCNTs’ optical transitions are explored that originate from the supposed van Hove singularities, which are induced by rolling-up the 2D sheet of graphene into a 1D CNT, as shown in Figures 1 and 2.
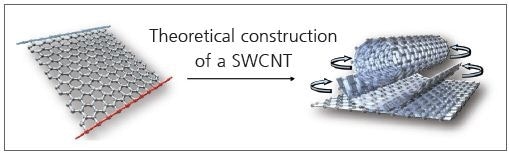
Figure 1. An SWCNT is a hollow cylinder of a rolled-up graphene sheet.
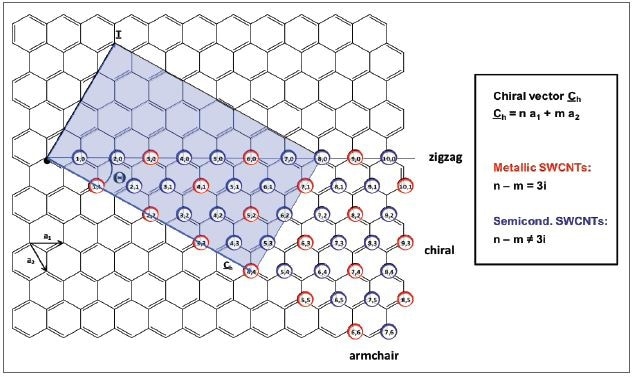
Figure 2. Schematic representation of the unrolled graphene layer of a carbon nanotube with the unit cell vectors a1 and a2 which define the chiral vector Ch. The colored rectangle displays the unit cell of the (4,4)-SWCNT. Metallic (n,m)-SWCNTs are indicated by the red circles, semiconducting species by the blue circles, respectively. SWCNTs exhibit metallic behavior, when n-m is a multiple of three. All other nanotubes are semiconducting.
Figure 3 shows a clear example of the electronic density of states of a semiconducting nanotube. Through light absorption, the electrons present in the van Hove singularities of the valence band are increased to the relative energy levels in the conduction band, represented as S11 and S22 with regard to semiconducting SWCNTs. Theoretically, the same process occurs in metallic SWCNTs, but there is a larger spacing between the van Hove singularities, so that only transitions of M11 can be investigated in the UV/Vis region.
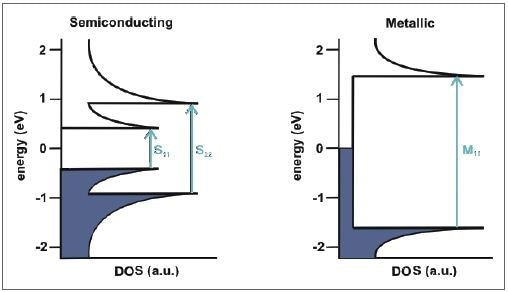
Figure 3. Schematic representation of the electronic density of states of a semiconducting (left) and metallic (right) SWCNT and the possible transitions between the van Hove singularities.
The easiest approach involves measuring the SWCNTs’ optical properties from solubilized/dispersed samples in transmission mode. Incidentally, the discovery of the dispersion of SWCNTs using physisorbed surfactant molecules, which control the nanoobjects, was believed to be a considerable breakthrough. During sample preparation, nanotubes are ultrasonicated in an aqueous surfactant solution and then centrifuged to eliminate large particulates that were not dispersed efficiently. The equally high van der Waals attraction of the SWCNTs can be overcome through the ultrasonication process, while the surfactant stabilizes the nanotubes, which are individualized or exfoliated.
Standard detergents like sodium dodecyl benzene sulfonate (SDBS) are the simplest surfactants, but highly efficient surfactants with an aromatic anchor have also been designed recently. The optical properties of SWCNTs are affected by a number of factors, and absorption spectroscopy provides access to the following data:
- Dispersion efficiency
- SWCNT sample composition
- Degree of individualization (qualitatively)
- Assessment of the sample purity
- Tracing interactions of SWCNTs and dyes
- Efficiency of separation processes
An appropriate UV/Vis/NIR spetrophotometer should be able to deal with both high absorbing liquids and low absorbance values with low spectral bandwidths in Vis and NIR and the best signal-to-noise ratio possible. Through an empirical comparison with SWCNTs, the PerkinElmer LAMBDATM 1050 Wide Band UV/Vis/NIR spectrometer was found to be the best choice for these types of experiments and to deliver the best performance.
The LAMBDA 1050 UV/Vis/NIR provides a double monochromator system with low stray light and helps study samples up to 8A in NIR and Vis regions. With the help of this system, the clear SWCNT peaks superimposed on the high absorbing background can be accurately measured in the whole spectral region. In addition, the high signal-to-noise ratio enables extremely low sample concentrations, for instance down to 0.2 µg/mL-1.
SWCNT Sample Composition
The SWCNT’s electronic structure is special for every (n,m) kind of nanotubes. As a result, absorption spectroscopy provides highly valuable data about the composition of the nanotube sample. This is particularly imperative because nanotubes are typically created as a combination of different electronic types and diameters. Figure 4 shows a standard absorption of SWCNTs dispersed in SDBS aqueous solution.
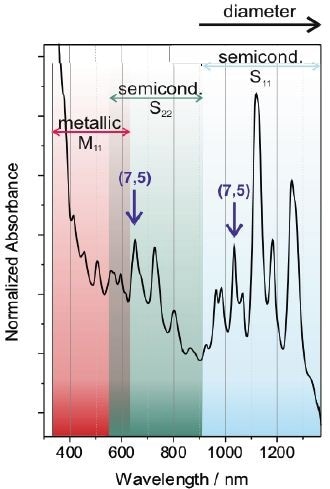
Figure 4. Typical absorption spectrum of a mixture of different SWCNTs dispersed in an aqueous solution of SDBS. The transitions of metallic and semiconductings SWCNTs are indicated by the shaded areas. The different peaks in the spectrum arise from different SWCNT species. In the case of semiconducting SWCNTs, one specific nanotube yields one peak in the S11- and one in the S22-regime, respectively as exemplarily shown for the (7,5)-SWCNT.
The transitions of metallic SWCNTs are explored in the UV/Vis region, while the semiconducting nanotubes are viewed in the NIR and Vis region. Individual peaks in the spectrum relate to a certain SWCNT species as exemplarily represented for the (7,5)-SWCNT. Larger diameter nanotubes are generally defined by pairs of van Hove singularities with a smaller energy gap, producing red-shifted peaks as opposed to smaller diameter nanotubes.
Dispersion Efficiency
As stated before, SWCNT dispersion is a major problem, as it allows solution-phase processing. The p-p-stacking interactions and van der Waals, which are similar to the stacking of each graphene layer in graphite, are responsible for an intense attraction between each SWCNT. As a result, SWCNTs are likely to create bundles and cannot be easily mixed in the absence of surfactants, which protect the nanotube surface. It is critical to evaluate the performance of a surfactant through a readily available method.
In a first estimation, several surfactants can be analyzed, and the same can be compared in their potential to disperse nanotubes by sonicating all of the SWCNTs in the presence of the surfactant, often at a varied concentration of both components, and then followed by ultracentrifugation. At a fixed wavelength, the absorbance ratio before and after the centrifugation step indicates the dispersion efficiency in % as shown in Figure 5a. However, this value should be taken as semi-quantitative, because various factors such as centrifugation conditions and sonication time power and time can affect the solubility efficiency. It is still very useful when new surfactants are evaluated against an established standard like SDBS.
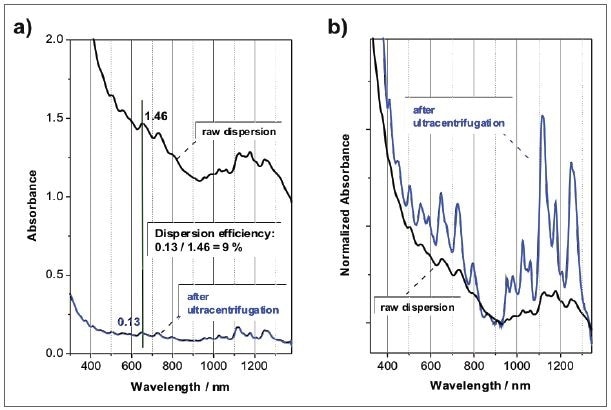
Figure 5. Absorbance spectra SWCNTs dispersed in an aqueous SDBS solution before and after ultracentrifugation. After ultracentrifugation, the sample is mainly composed of individualized SWCNTs, but at a much lower concentration: a) absorbance spectra with a pathlength of 1 cm; b) same spectra, but normalized to the local minimum.
Degree of Individualization
In addition to the dispersion efficiency that can be measured through absorption spectroscopy, the pattern and peak positions provide data about the dispersion quality, including the individualization of the SWCNTs. Figure 5b shows an example where a raw dispersion of SWCNTs in aqueous SDBS is compared to the same sample following ultracentrifugation. Though the centrifugation process, nanotube bundles and aggregates are removed so that the dispersion includes individualized nanotubes mainly, but at a relatively lower concentration. For the sake of comparison, the spectra were standardized to the local minimum between the S11 and S22 transitions at 920 nm. A striking variation can be seen in the pattern of the absorbance spectrum, because the peaks emerging from the SWCNT optical transitions are considerably sharper and more intense with regard to the unspecific absorbance background.
In addition, red-shifted peaks are seen in the raw dispersion, as the transitions are of lower energy and are widened when the SWCNTs are in van der Waals contact to one another. Therefore, the position of the peak and relative intensity indicate the extent of debundling in the sample, which is a major decisive factor to assess the quality of the SWCNT dispersion. A suitable sample would be defined as having high carbon loading with a high degree of individualization. Figure 6 shows an example that can be effectively used to show the influence of the degree of bundling and debundling.
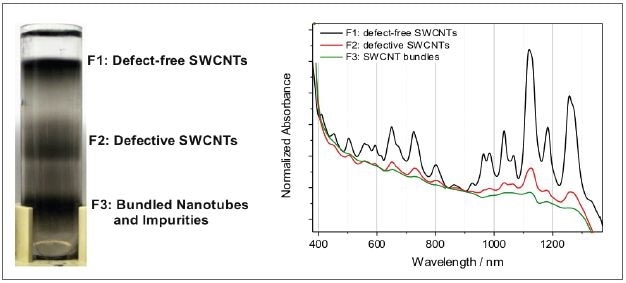
Figure 6. Left: centrifugation vial after separating individual defect-free nanotubes from defective counterparts and bundles. Right: the difference in the material composition is reflected in the absorbance spectra.
In this case, density gradient ultracentrifugation was used to sort a nanotube raw dispersion. This procedure helps to separate individualized, defect-free nanotubes from the defective material and nanotube bundles and impurities in fraction F3. Figure 6 shows the relative absorption spectra standardized to the local minimum.
The absence of the typical nanotube transitions defines the bundled nanotubes and impurities. Here, only the powerfully absorbing background is documented. Defective nanotubes are gathered in fraction F2, and the typical nanotube peaks are overlaid on the background, but relatively weaker as opposed to the defect-free counterparts in fraction F1.
Evaluation of the Sample Purity
The ratio of the nanotube peaks to the non-resonant background relies on the sample structural integrity and purity of the nanotubes, as shown in Figure 6b. Typically, pure and defect-free nanotubes exhibit a resonant ratio of 0.15 within the area highlighted by the shaded area in Figure 7, whereas the raw dispersion resonant ratio is characteristically in the range of 0.03.
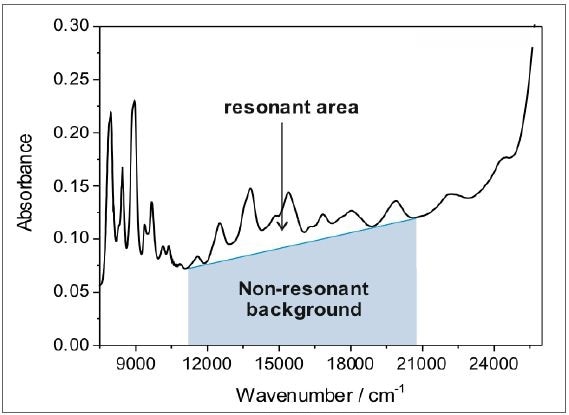
Figure 7. The ratio of the resonant area of the characteristic SWCNT peaks to the nonresonant background yields information about the sample purity and structural integrity. Defect-free and pure nanotubes typically have a resonant ratio of 0.15 (within the region marked by the grey shaded area), while the resonant ratio of raw dispersions is typically in the range of 0.03.
With the above-described sorting methodology, it is possible to find out the resonant ratio of perfect, defect-free nanotubes. The as-acquired resonant ratio can be applied as a reference system to measure the amount of defect-free nanotubes in a specified nanotubes sample, which is often a blend of amorphous carbon, defective species, and defect-free nanotubes.
This is a vital factor, as other techniques like thermogravimetric analysis can merely record the proportion of non-carbon impurities like catalyst particles, or do not promote a quantification. Based on the resonant ratio, absorption spectroscopy, in tandem with smart sorting methods like ultracentrifugation allows accurate quality monitoring for HiPco SWCNTs that are commercially available in the market. It was observed that about 20% of the carbon-based material is due to the nanotubes that are intact and structurally perfect.
Tracing interactions of dyes and SWCNTs
A considerable part of SWCNT studies is dedicated to interpreting the interactions between molecules and the carbon surface. In this context, absorption spectroscopy could help to establish the interaction between dyes and the nanotube surface. It has been discovered recently that the SWCNTs can be efficiently dispersed and separated in aqueous solution through amphiphilic perylene bisimide derivatives.
A marked interaction is seen between the nanotube’s aromatic core and the nanotube‘s aromatic backbone, and the nanotube’s aromatic core acts as an anchor to the sidewall. With its carboxylic acid functionalities, the dendritic unit offers the system’s water solubility. Through absorption spectroscopy, the adsorption of the perylene bisimide core to the nanotubes can be seen, as the peak position and pattern of the perylene derivative and nanotubes change considerably (Figure 8).
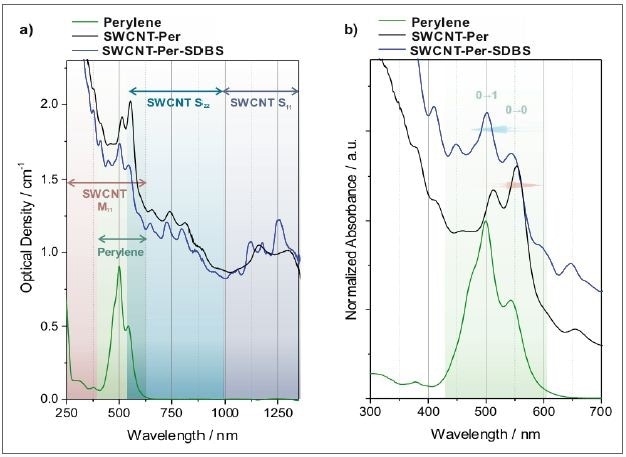
Figure 8. Absorption spectra of SWCNTs dispersed in an aqueous solution of a perylene bisimide dye. a) As recorded spectra where the characteristic transitions of semiconducting SWCNTs (S11 and S22) and metallic SWCNTs (M11), as well as the perylene transitions are indicated. b) Magnified view of the perylene transitions. The spectra are normalized to the strongest perylene transition and offset for clarity. The replacement of the dye from the nanotube surface by addition of SDBS can be followed by the respective absorption spectra (black trace: perylene adsorbed to SWCNTs, blue trace: same sample after substitution of perylene by SDBS).
The perylene molecule has amphiphilicity, and is intensely self-aggregating in aqueous solution, producing an absorption spectrum with a more pronounced 0-1 transition as opposed to the 0-0 transition (Figure 8b). As soon as the dye adheres to the surface of the nanotube, the micelles are broken up and a fingerprint of monomeric perylene is seen overlaid on the nanotube spectrum. Nonetheless, contrary to monomeric perylene bisimide molecules in solution, the red-shifted peaks are the result of the interaction with the nanotube.
Likewise, the transitions of SWCNTs are modified, that is broadened and red-shifted, when the dye is adsorbed compared to a nanotube spectrum in a detergent solution. This is best seen when SDBS is added to substitute the perylene from the nanotube scaffold, indicated by blue trace in Figure 8.
Following the substitution, the perylene and nanotube absorbance peaks are shifted to lower wavelengths and seem to be sharper. The perylene signature of self-aggregated structures is acquired in the UV/Vis area in perfect agreement. With the aid of absorption spectroscopy, the marked interaction of the nanotube and the dye can be efficiently validated. This observation can also be leveraged to find out a suitable ratio of nanotube to dye, where there is a minimal concentration of free surfactant.
Efficiency of Separation Procedures
Over recent years, different methods have been detailed to isolate CNTs by length, diameter, electronic properties, and type. As sorting often takes place in solution, absorption spectroscopy has evolved to become a key characterization tool to assess the effectiveness of sorting. The main benefit is that both semiconducting and metallic SWCNTs can be studied, unlike emission spectroscopy that can only be used in the case of semiconducting species.
Figure 9 shows the absorption spectra produced following an efficient separation, which is on the basis of selective interaction of varied DNA sequences. These DNA sequences swathe around the nanotubes based on their structure, so that separation by ion exchange chromatography method is readily available. This separation process helped in extracting 12 diverse nanotube species that can be distinctly detected by their typical absorption spectra.
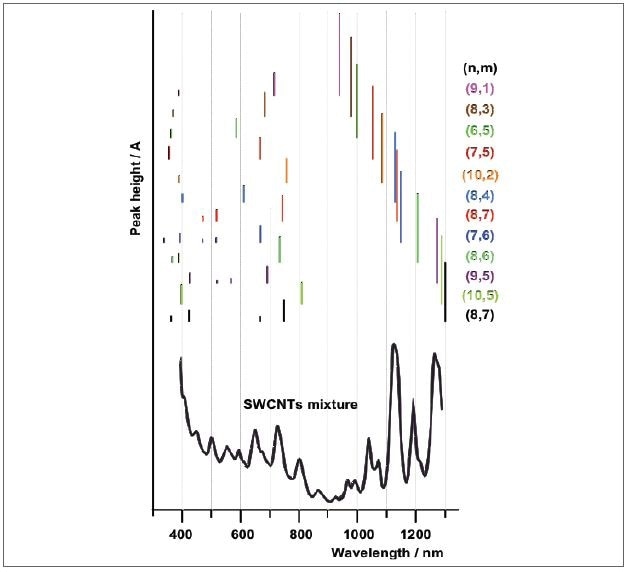
Figure 9. Schematic representation of the absorption spectra of sorted SWCNTs adapted from reference. The separation of 12 individual SWCNT species enabled the assignment of the absorption peaks to the various species in a mixture of nanotubes (top spectrum).
Conclusion
UV/Vis/NIR absorption spectroscopy has emerged as a robust characterization tool for CNT dispersions, and has considerably helped in gaining a better understanding on nanotube purity, sorting, and functionalization that were detailed in the past years.

This information has been sourced, reviewed and adapted from materials provided by PerkinElmer Inc.
For more information on this source, please visit PerkinElmer Inc.