Semicrystalline polymers are known to have a rigid amorphous fraction (RAF), which is present at the interface of the amorphous phase and crystal due to the immobilization of a polymer chain caused by the crystal. It is still not clear whether the devitrification of RAF occurs after crystal melts or vice versa. As both the RAF devitrification and crystal melting occur at the same temperature range, it is difficult to answer this question.
Sometimes the RAF fraction is present at the surface of silica nanoparticles that exist in the polymer silica nanocomposites material. Nevertheless, the silica nanoparticle remains unchanged at the temperature during the devitrification of RAF. So polymer silica nanocomposites provide an option to analyze the devitrification of RAF.
According to the results of certain studies, a second glass transition (Tg) from RAF is observed in dynamic measurements. However, a second Tg is not apparent in polymer nanocomposites from DSC experiments. It is critical to have absolute heat capacity measurement to determine RAF in DSC.
A formula has been developed for RAF determination in semicrystalline polymers using accurate heat capacity measurement as explained by Wunderlich. It involves the performance of heat capacity measurement to determine a possible second Tg on PMMA nanocomposites consisting of silicon oxide nanoparticles of various shapes. Heat capacity was accurately determined using StepScan™ DSC, and degradation was prevented and devitrification of the RAF was identified at higher temperatures using HyperDSC®.
Experimental
A PerkinElmer® Diamond DSC was used to obtain accurate heat capacity curves. StepScan, a special model of temperature modulated DSC, was used to determine heat capacity. Samples of roughly 20 mg were used to perform measurements: 3 K steps at 6 K/min heating rate and isotherms of roughly 1 minute. The temperature range was typically 30-170°C (if not otherwise specified).
Sapphire for heat capacity and indium and zinc for temperature were used at zero heating rate in order to calibrate the instrument as per GEFTA recommendations. Variations from the zero rate calibration were below 0.2 K and were not taken into account further because of the low underlying heating rate (3 K/min). Uncertainty was roughly 2% for heat capacity. Polymer degradation was prevented up to 360°C by performing the HyperDSC measurement at a rate of 400 K/min.
Results
Figure 1 depicts the polymer silica nanocomposite material, showing three phases: mobile amorphous polymer phase, silica nanoparticles, and rigid amorphous phase at the particle interface. The observed step in heat capacity (ΔCp) at Tg for semicrystalline polymers is often lower than expected from crystallinity. Therefore, the concept of a rigid amorphous fraction (RAF) was introduced by Wunderlich et al:
 |
Equation 1 |
Where, ΔCp and ΔCp pure = The respective heat capacity increments at Tg for semicrystalline and amorphous polymers. The ratio of both step heights indicates the fraction of the polymer that plays a role in the glass transition, which is called mobile amorphous fraction (MAF). A reduced step height (relaxation strength), ΔCp, is observed sometimes for polymer nanocomposites at glass transition. Likewise, it is possible to determine an immobilized or rigid amorphous fraction from heat capacity as per Equation 1, substituting the crystalline by the nanoparticle fraction.
 |
Equation 1 |
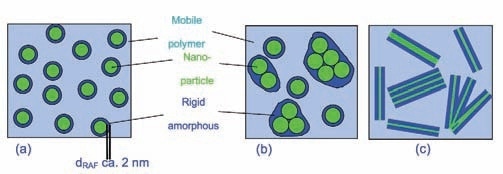
Figure 1. Sketch of spherical (a, b) and layered (c) nanoparticles covered by a layer of immobilized polymer (RAF). Total deglomeration of the particles is assumed in (a); a more relaistic situation is shown in (b) and (c).
Accurate heat capacity data in the glass transition temperature range of the polymer nanocomposite is required to apply Equation 2. The specific heat capacities measured for the PMMA based nanocomposites are presented in Figure 2. The curves were calculated in respect to the sample mass (polymer + nano particles).
In case of semicrystalline polymers, a slight increment in the glass transition temperature was seen for all nanocomposites subsequent to careful drying at reduced pressure. The half step temperature derived from the StepScan DSC measurements was determined as the Tg of the nanocomposites. There is a slight difference in the values in comparison with scan measurements at a rate of 10 K/min due to the difference in the time scale of the experiment.
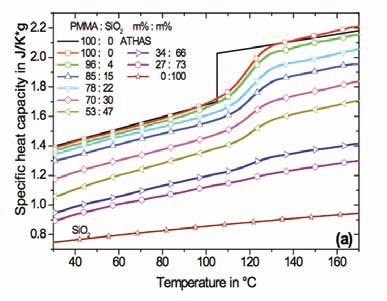
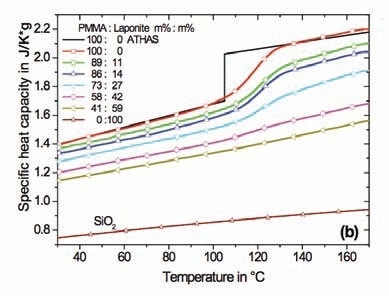
Figure 2. Specific heat capacity of nanocomposites in respect to sample mass. (a) – PMMA with spherical SiO2 nanoparticles, (b) – PMMA with Laponite RD™. Specific heat capacity for SiO2 is shown too. The black lines represent reference data for PMMA from ATHAS. Diamond DSC, StepScan mode.
Equation 2 was applied to quantify RAF in the PMMA nanocomposites. The step in heat capacity was determined at the glass transition for various samples as usual at Tg, followed by normalization by the step in heat capacity for the pure polymer. Figure 3 shows the results for the PMMA and PS nanocomposites. As per Equation 2, the diagonal in Figure 3 signifies the case when RAF is absent. Alternatively, a two phase system (filler + polymer) is anticipated in the absence of interfacial immobilization. The data obtained for the PS nanocomposite is close to this line. The drop in the normalized relaxation strength is much more than the diagonal for the PMMA nanocomposites.
Figure 3. Calorimetric relaxation strength as a function of nanofiller content. The vertical double arrow indicates the amount of RAF for PMMA at 27m% Laponite RD™ filler. Symbols:  PS with spherical SiO2 nanoparticles;
 .jpg) PMMA with spherical SiO2 nanoparticles;
PMMA with spherical SiO2 nanoparticles; .jpg) PMMA with Laponite RD™ clay nanoparticles. The inset shows the percentage of the RAF versus filler content, see text.
PMMA with Laponite RD™ clay nanoparticles. The inset shows the percentage of the RAF versus filler content, see text.
According to Equation 2, it is possible to obtain the different fractions from the normalized relaxation strength. The upper arrow at 27 m% filler is relative to the filler fraction. The lowest signifies the mobile amorphous fraction (MAF) that contributes to the calorimetric relaxation strength at glass transition. The variation between the diagonal (middle arrow) and measured values signifies the immobilized (rigid) fraction (RAF), which can be computed in accordance with Equation 2.
Straight lines in Figure 3 are relative to a constant ratio between RAF and filler fraction. Alternatively, each filler particle is assumed to be covered by the same quantity of RAF (all according mass) in ideal cases. The data in Figure 2 does not fully justify this assumption. The mass percentage of the RAF normalized by the filler content is depicted as a function of the filler mass fraction in the inset. A constant ratio is expected to be found between the RAF and the filler content if the same immobilized layer covered all of the nanoparticles. A slight drop in the ratio represents a decrease of the RAF per nanoparticle with rising filler concentration. This is most likely due to particle agglomeration schematically represented in the inset. Hence, the effective surface is not in proportion to the filler content. Then, the points in Figure 3 must follow a parallel line to the diagonal. This can be observed for the highest filler fractions.
Heat capacity measurements were performed up the degradation of the polymer to check the nature of the RAF layer and to determine a possible second Tg. Accurate heat capacity data was obtained up to the onset of degradation using the StepScan DSC. Measurements were carried out up to degradation temperature, but due to the isotherm subsequent to each 3 K temperature step, it is possible to obtain heat capacity until the heat flow during the isotherm became unstable. The devitrification of RAF is anticipated to emerge as a second step in heat capacity towards liquid heat capacity. However, no step like or gradual transition is observed up to the temperature of 250°C, where the onset of polymer degradation occurs at slow heating.
High heating rates can be used to reduce the impact of degradation on the determination of heat capacity. HyperDSC5 measurements were carried out at a heating rate of 400 K/min to shift the onset of degradation to elevated temperatures. Additionally, the sensitivity of the measurement is increased by the fast scanning rate. A second Tg caused by RAF was easier to detect with fast scanning experiments. The degradation of the polymer in the nanocomposite does not occur up to roughly 360°C at a heating rate of 400 K/min. However, no second Tg is observed below 360°C (Figure 4), meaning that there is a strong interaction between the nanoparticle and the polymer matrix. Heating up to elevated temperatures is therefore not adequate to eliminate the anchors and to enable relaxation and devitrification of the RAF.
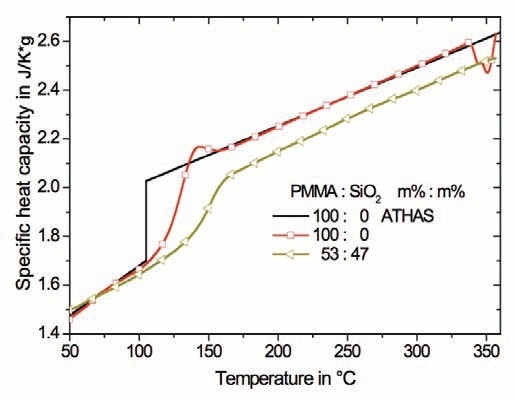
Figure 4. HyperDSC measurements at a heating rate of 400 K/min for pure PMMA and the nanocomposite consisting of 47 m% spherical SiO2 nanoparticles. The sample mass was 0.5mg. The black lines refer to reference data for PMMA from ATHAS.
Interaction between SiO2 and PMMA at the interface of the nanoparticles is anticipated to be inferior to a covalent bond exist in polymer chains leaving the crystal and proceeding in the amorphous region between the lamellae. If the non covalent bond between the inorganic nanoparticle and the PMMA does not allow devitrification before degradation of the polymer to occur it is very unlikely that in semicrystalline polymers the RAF devitrifies as long as the polymer chains are covalently anchored to the rigid polymer crystals. However, the polymer crystals are most likely to melt or achieve mobility in another way before the relaxation and devitrification of the RAF.
Conclusion
The heat capacity was determined accurately at the glass transition of the polymer using the StepScan method. This demonstrated the existence of an immobilized fraction in PMMA SiO2 nanocomposites. It was revealed that there is a strong interaction between the PMMA and the SiO2 nanaoparticles that prevents RAF devitrification before polymer degradation. HyperDSC further confirmed the nonexistence of a second glass transition. The results acquired for the polymer nanocomposites support the viewpoint that the reason for limited mobility must vanish before the devitrification of the RAF. This means that melting rigid crystals must occur before the relaxation of the RAF in the case of semicrystalline polymers. RAF devitrification may occur before melting only for semicrystalline polymers with noticeable chain mobility within the crystals.

This information has been sourced, reviewed and adapted from materials provided by PerkinElmer Inc.
For more information on this source, please visit PerkinElmer Inc.