Graphene is a two-dimensional form of carbon arranged in one-atom thick layers. Carbon atoms in graphene are tightly packed in a regular hexagonal pattern. Mathematically, graphene can be treated as a considerably large aromatic molecule, and due to this electronic and distinctive physical structure, can create new electronic effects.

Shutterstock | Rost9
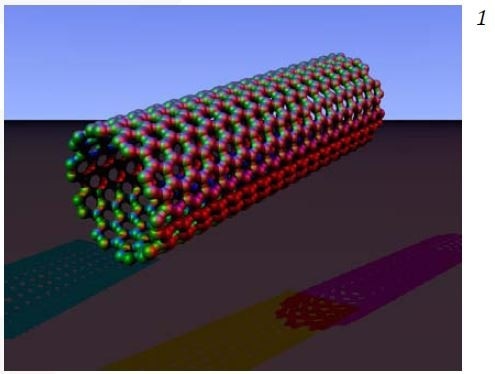
Carbon nanotubes (CNT) can be considered as graphene which forms a tube instead of a sheet. CNT is considered to be a one-dimensional material composed of a different set of properties than two -dimensional carbon. In terms of structure, the CNT material is a long, hollow tube that contains a single graphene layer rolled at a particular angle to form a cylinder, and it is this angle that affects the tube’s electronic properties.
Nested tubes can be formed with many layers of graphene, which are commonly referred to as multi-walled nanotubes. CNTs are formed of many sp2 bonds between separate carbon atoms, which results in the enormous tensile strength possessed by individual CNTs. In addition, this structure promotes multiple other characteristics that can be advantageous to a wide range of industries, including unique mechanical, optical, thermal and electrical properties.
Photoluminescence, absorbance and Raman spectral characteristics are clearly exhibited by CNTs. This makes optical microspectroscopy an excellent tool for nondestructive analysis of CNTs, enabling engineers and scientists to investigate and “tune” the properties of newly developed forms of CNTs. One key application of microspectroscopy to CNTs lies in quality control, where it is employed to find out contaminants and structural defects, and validate preferred properties.

Figure 1. The 2030PV PRO™ UV-VIS-NIR microspectrophotometer from CRAIC Technologies. This instrument can be configured for transmission, reflectance, fluorescence, photoluminescence and Raman spectroscopy and imaging
Several methods have been developed by CRAIC Technologies that can be integrated on a single instrument and can be used for studying CNTs, graphene and other one, two and three-dimensional structures.
UV- Visible-NIR Microspectroscopy
In the near infrared and ultraviolet regions, transmission microspectroscopy is a method that has been shown to be useful for the identification and characterization of CNTs. There are some fascinating optical absorptions that emerge from ν1-c1, ν2-c2, etc. electronic transitions, also known as van Hove singularities.
As a result, the spectrum has sharp features. If the CNT structure is changed, the optical properties can be tuned which can help in the identification and characterization of CNTs. Sample preparation for UV transmission microspectroscopy is a simple process, and therefore this has become a reliable method for identifying the type of CNTs in a sample in addition to their structure and purity.
Pure, single walled CNTs, for example, display strong absorbance maxima at 280 nm because of the CNT. In pure, single-walled materials, the van Hove transitions occur well into the NIR region at about 1240 nm for ν1-c1 (also known as S11 transition) and 700 nm for ν2-c2 (also known as S22 transition).
These transitions are depicted in Figure 2, showing the transmission microspectra™ of aggregated single walled CNT dropcast on a quartz slide from an acetone suspension.
The characteristic single walled CNT peak is clearly seen at 280 nm, but the van Hove transitions are broadened and red-shifted because the dispersion creates a CNT network in van der Waals in contact with each other. Therefore, the peaks’ wavelength can be used to characterize the extent the aggregated CNTs are tightly bound together.
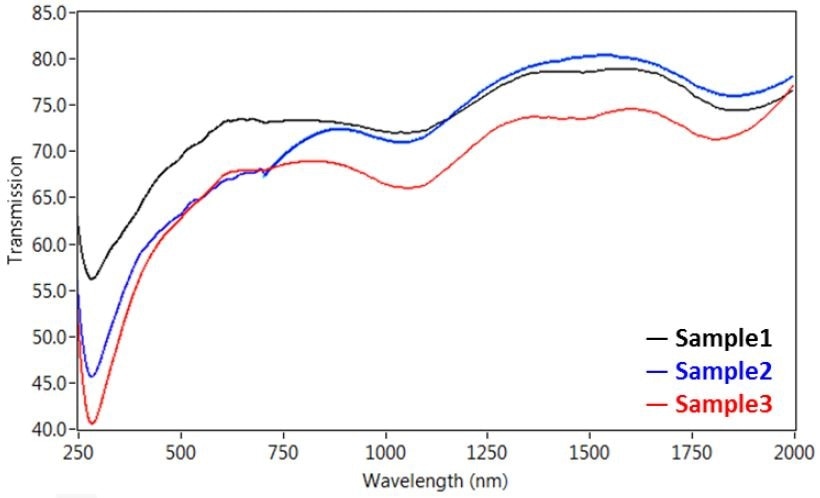
Figure 2. Transmission microspectra™ of single walled CNT dropcast on a quartz slide from an acetone suspension, with peaks at ~280, 1050, and 1850 nm.
Ultraviolet Microscopy
Although standard microscopy using visible wavelengths can be useful, another major tool available for rapid detection of CNT locations is through UV microscopy.
The CNT locations can be easily and quickly confirmed with microscopy (Figure 3), by utilizing a bandpass filter at an absorption peak of the sample (i.e. 280 nm) and imaging with a UV-capable camera.
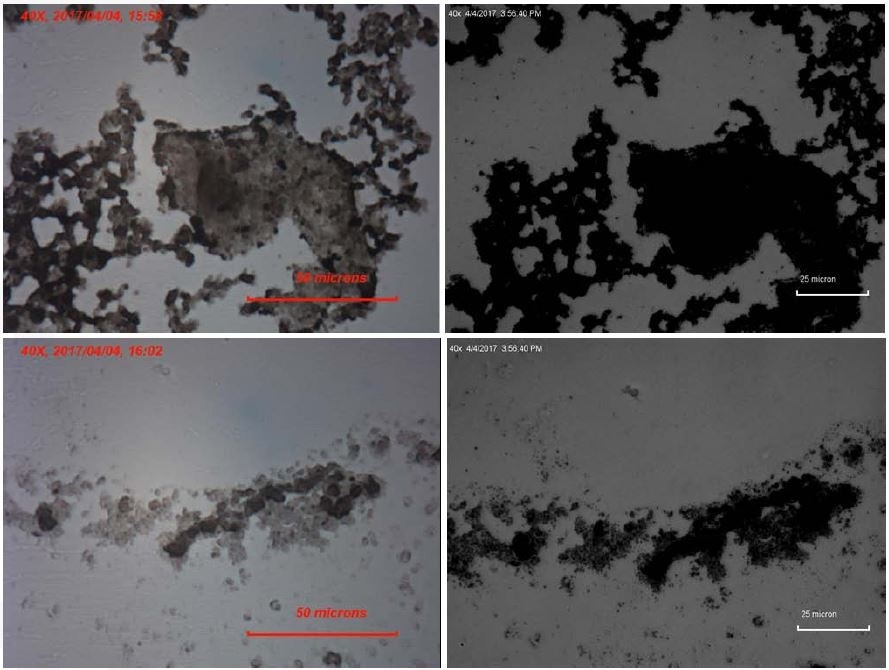
Figure 3. Standard visible images (left) and corresponding UV images at 280 nm (right) of single walled CNT dropcast on a quartz slide from an acetone suspension.
Photoluminescence Microspectroscopy
When single walled CNTs are excited by photon with an energy corresponding to the S22 transition, they produce NIR light. Initially absorbed by the CNT molecule, the photon relaxes through the S11 transition and the photon emitted corresponds in energy to the S11 transition.
The emission wavelength is highly variable and depends on the CNT structure. The PL of single walled CNTs is also linearly polarized along the long axis of the CNT. This enables the monitoring of CNT orientation without any extra effort.
Raman Microspectroscopy
Yet another extremely useful spectroscopic tool is Raman microspectroscopy, because the vibrational spectra acquired can be used to detect molecular bonds and spot the differences in local environments.
This is because specific vibrational frequencies are possessed by the bonds formed between atoms. And these frequencies correspond to an atom's strength and mass of the bond between the atoms. Hence, complex molecules show many peaks and can be quickly identified by the "fingerprint" or pattern produced by those peaks. For one and two-dimensional materials, this is particularly useful because the sampling area is restricted by the size of the laser spot, and it is capable of detecting the differences in local environments.
There are three characteristic peaks in graphene based materials that are often seen in the Raman spectra (Figure 4). These are specifically called the D-peak at 1360 cm-1, 2D peak at 2700 cm-1, and G-peak at 1600 cm-1. The D-peak is indicative of impurities or disorder in the carbon-based structure, while the G-peak is the result of carbon-carbon bond stretching. In addition, the 2D peak is common to all graphite samples, and its width, intensity and location can be used to find out the number of sample layers.
This spectrum containing the D peak indicates disorder in the sample, and this peak’s intensity can be used to determine the disorder in the sample. The local environment, such as solvents, substrate and localized defects will influence the exact frequency of these vibrations.
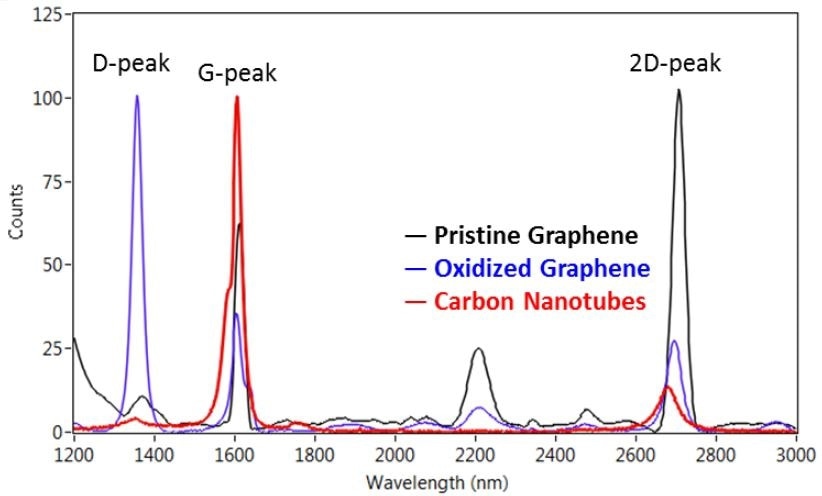
Figure 4. Raman spectra of graphene and carbon nanotube samples. The D, G, and 2D peaks are clearly visible in all three samples. The additional band observed at ~2205 cm-1 is due to the substrate that the graphene samples were mounted on.
Microspectroscopy
CRAIC Technologies design and develop UV-visible-NIR range microspectrometers for a wide range of applications. The company integrates several different spectroscopic techniques into a single instrument that can measure the spectra of micron-scale sample areas.
Shown in Figure 5 is an optical diagram of a microspectrophotometer that is configured for transmission microspectroscopy. Here, the light is focused onto a sample, which is graphene in this case and the transmitted light is collected and imaged onto the spectrophotometer’s entrance aperture.
As the entrance aperture of the spectrophotometer is mirrored, an image is also the entrance aperture superimposed on the sample measurement area. This allows for simple yet fast alignment.
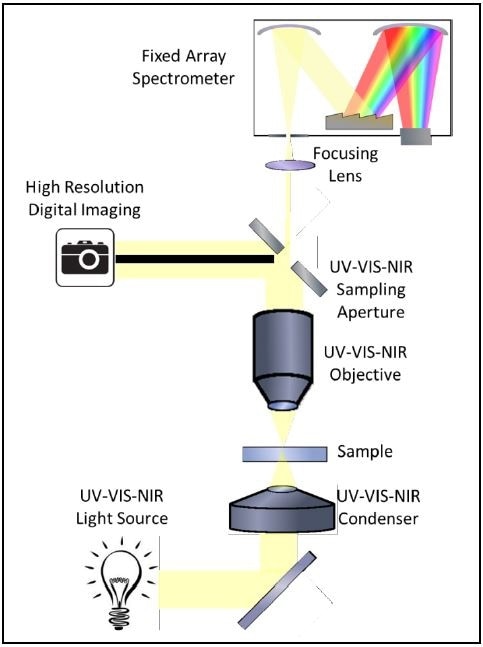
Figure 5. Optical diagram of a microspectrophotometer configured for UV-VIS-NIR transmission microspectra™.
In the case of Raman microspectroscopy, the optical diagram is somewhat different which is attributed to the nature of these types of experiments. Shown in Figure 6 is an optical diagram of a microspectrometer configured for Raman microspectroscopy.
Through incident illumination, the laser is focused onto a sample (graphene) and the Raman scattered light is collected and imaged onto the spectrophotometer’s entrance aperture, and this is followed by collecting a Raman microspectra™.
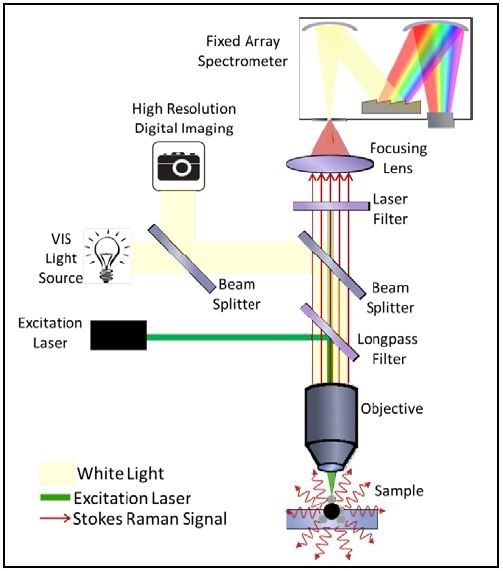
Figure 6. Optical diagram of a microspectrophotometer configured for Raman microspectra™.
Apart from the standard color imaging, the microspectrometer also has capabilities for NIR and UV imaging. This instrument can be configured for photoluminescence, reflectance, polarization microspectroscopy, kinetic spectroscopy, 5D spectral surface mapping and small spot thin film thickness measurements.
References
1 Carbon Nanotube image By Arnero - Own work, Public Domain, https://commons.wikimedia.org/w/index.php?curid=3153687
2 Mak, K.F., Solid State Communications, 152, 1341–1349 (2012).
3 Bonaccorso, F. Nature Photonics, 4, 611 - 622 (2010).
Nikolaenko, A., Zheludev, N., Physical Letters Review, 104(15) (2010)

This information has been sourced, reviewed and adapted from materials provided by CRAIC Technologies.
For more information on this source, please visit CRAIC Technologies.