Electric vehicles, the internet of things, renewable energy and expanding rural electrification are expected to be growing sectors in the coming decades.
Complementary energy storage solutions such as batteries will be necessary to time-shift renewable energy generation so that power remains obtainable when sources like solar and wind are not immediately available.
Worldwide demand for battery capacity is expected to expand by an order of magnitude from its current level to over 2 terawatt-hours by 2030.1 A large proportion of this extra capacity will be used in the increased production in a number of areas including:
- Electric vehicle fleets and their related charging infrastructure
- The internet of things
- Mobile devices
- Large-scale, long-duration storage to secure the grid
- The time-shifting of renewable solar and wind generation
- Adding resilience to critical infrastructure against disaster and climate-change-related outages
What is a Battery?
For many, a battery probably brings to mind images of the cylindrical batteries that are found in a wide range of items, from flashlights to toys. The more accurate descriptor for these is actually ‘cells’ as a battery typically denotes a group of cells.
Cells can be placed in series and in parallel facilitating the manufacture of a battery of virtually any shape and size. It is conceivable to view a battery as a larger-capacity, larger-power cell in itself. While the terms have become exchangeable in common parlance, this article will refer to them as batteries.
Every battery will comprise the same basic elements, including:
- A negative and positive electrode terminal - anode and cathode - or the reverse, dependant on whether the battery is discharging or charging
- An electrolyte that is generally an ionically conductive fluid
- Reactant materials that facilitate the storage of the electrical energy in chemical bonds inside the device
- A separator that facilitates ion-selective flow between the anode and cathode
- Housing which will encapsulate the whole structure, protecting the contents from the atmosphere
During discharge and charge (red and blue arrows, respectively), electrochemically-generated electrons from the reactants will move between the positive and negative electrode terminals through an external circuit, either driving a load or being driven by a power source.
Complementary positive ions will move through the electrolyte and separator elements inside the device (Figure 1).
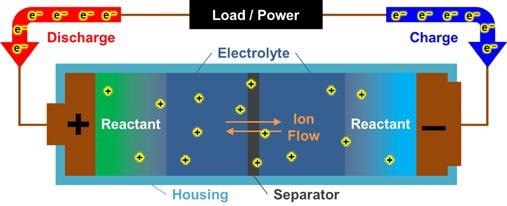
Figure 1. Schematic showing the various basic components of a battery. Image Credit: Asylum Research - An Oxford Instruments Company
Through research and engineering, batteries can optimize any individual component. This is usually driven by the following:
- Increasing kWh/m2 – the footprint energy density
- Increasing kWh/kg – the specific energy density
- Increasing kW/m2 – the footprint power density
- Increasing kW/kg – the specific power density
- Decreasing $/kWh/cycle – the specific installed cost per cycle
- Decreasing $/kWh – the specific installed cost
Measuring Battery Performance
Numerous researchers will analyze various battery components and chemistries and test the performance of the subsequent devices by means of standard electrochemical cycling methods and spectroscopic techniques.
A comprehensive understanding of battery materials and operation can be derived from analysis at the nanoscale, which is achievable by utilizing Atomic Force Microscopy (AFM).
AFM entails a probe physically interacting with the surface that it is mapping. This allows a range of data to be obtained, including:
- Conductivity
- Topographical changes
- Nanomechanical properties
- Molecular ordering
This type of analysis has historically been difficult - even when using an AFM - as batteries contain delicate materials (like lithium) that are air- and moisture-sensitive.
Standard battery structures cannot be tested without taking them apart, which leads to the resulting destruction of the battery and its function. This means that more innovative imaging techniques are needed.
While there are apparent difficulties, the analysis of batteries at the nanoscale continues to be vital. The AFM meets this necessity, allowing the advanced measurements described above to be executed at different levels of complexity and difficulty.
Ex-situ battery measurements are generally straightforward and easy. This entails acquiring images of the appropriate battery component outside of an assembled battery structure, possibly in an uncontrolled or ambient atmosphere.
In-situ battery measurements are generally complex and moderate, acquiring images of the battery components in a chemical environment that is relevant for the operation of the battery.
Operando battery measurements are intricate and difficult and entail the acquisition of images of the battery components during operation, meaning discharging or charging in physically-relevant chemical conditions.
Asylum AFMs for Battery Research
Oxford Instruments Asylum Research supplies three separate AFM platforms for battery research (Figure 2).
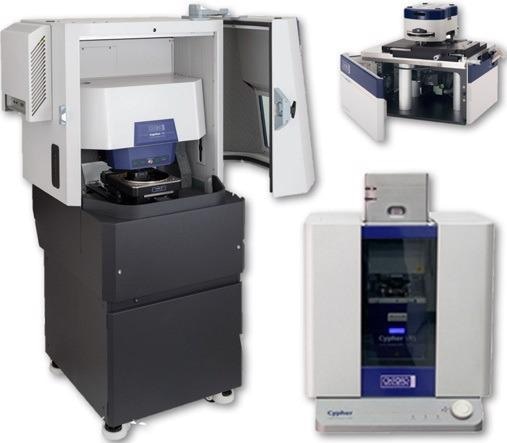
Figure 2. AFMs offered by Oxford Instruments Asylum Research for battery research. Image Credit: Asylum Research - An Oxford Instruments Company
The MFP-3D is an extremely versatile AFM, offering high resolution. It has a wide array of accessories, including an electrochemistry cell.
A large-sample AFM, the Jupiter XR, allows the acquisition of images up to 100 x 100 microns on samples up to 200 mm (8 inches) in diameter. It does this while still delivering ultra-high resolution and high throughput. It comes with a suite of accessories for environmental control, with more in ongoing development.
The Cypher ES offers the greatest speed and resolution, along with a comprehensive environmental control for sensitive chemistries. It also incorporates a completely sealed electrochemistry cell and sample cell.
Energy storage materials are often air- and moisture-sensitive. This necessitates a level of rigorous control over reactor conditions that ex-situ imaging is unable to provide.
To carry out measurements in conditions that are similar to the inside of an operating battery, the AFM can be placed inside a glovebox to benefit from its controlled environment.
The added vibration and noise of a glovebox means there are unavoidable trade-offs in terms of both performance and ease of use for most AFMs. The Cypher ES, which is compact enough for glovebox use, retains its ease of use and ultra-high resolution performance, even when the pumps are running.
The scannable QR code provides more information about imaging under these conditions (Figure 3).
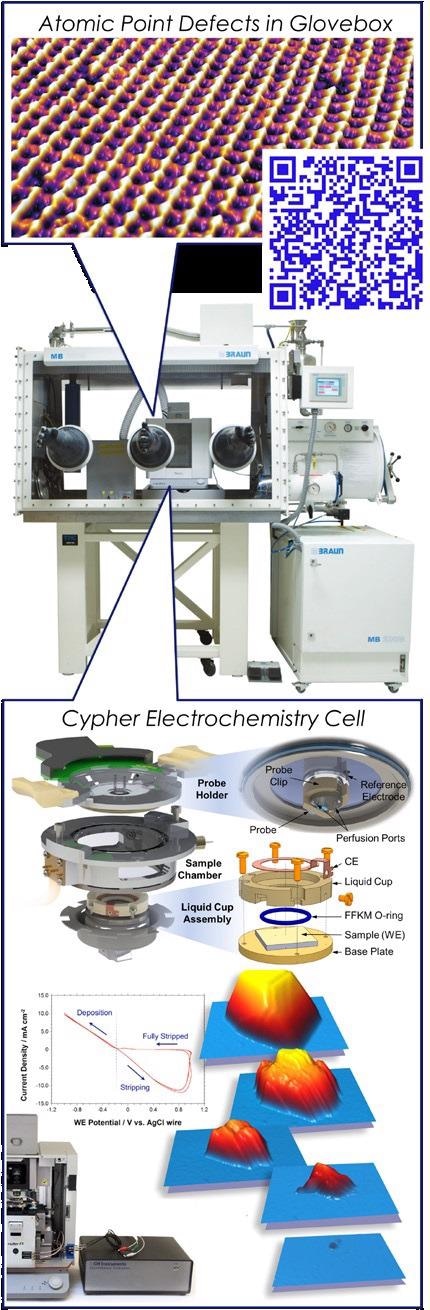
Figure 3. (Top) The Asylum Research Cypher ES AFM shown in a glovebox. (Bottom) The Cypher electrochemistry cell can be used either in a glovebox, as shown, or under ambient conditions. Image Credit: Asylum Research - An Oxford Instruments Company
During in situ and operando measurements, images are acquired at interfaces inside a device. Electrical contacts and voltage control have to reach the reactive surfaces, which can be achieved by assembling an electrochemical cell within the AFM.
The Cypher ES AFM possesses a modular and flexible closed cell design for complete environmental control and liquid containment. It also supports almost any potentiostat.
Ex-situ AFM Measurements
The easiest way to begin characterizing battery components with AFM is to take the relevant measurements outside of an assembled battery structure. Lithium and other materials are excluded from this approach due to air and moisture sensitivity concerns.
Materials such as battery housing materials, current collector components, or electrode films may be accessible where they do not warrant strict engineering controls.
One benefit of ex-situ imaging is that practically all AFM characterization modes are relatively easy to execute in ambient conditions, allowing for cross-mode correlative imaging.
Battery Cathode Materials
One of the most popular cathode materials for higher energy density Li-ion batteries is LiNixMnyCozO2 (NMC).
To investigate the effectiveness of AFM in characterizing NMC, sample sheet films on an Al current collector were purchased from MSE Supplies. These were subsequently characterized with the Jupiter XR AFM - as-received - with minimum preparation.
Conductive AFM (CAFM) was utilized to visualize nanoscale distributions of conductivity across the sample at a variety of length scales:
This allowed the current to be correlated with a range of topographic features, including interstitial grooves, larger ‘boulders,’ and grains (Figure 4).
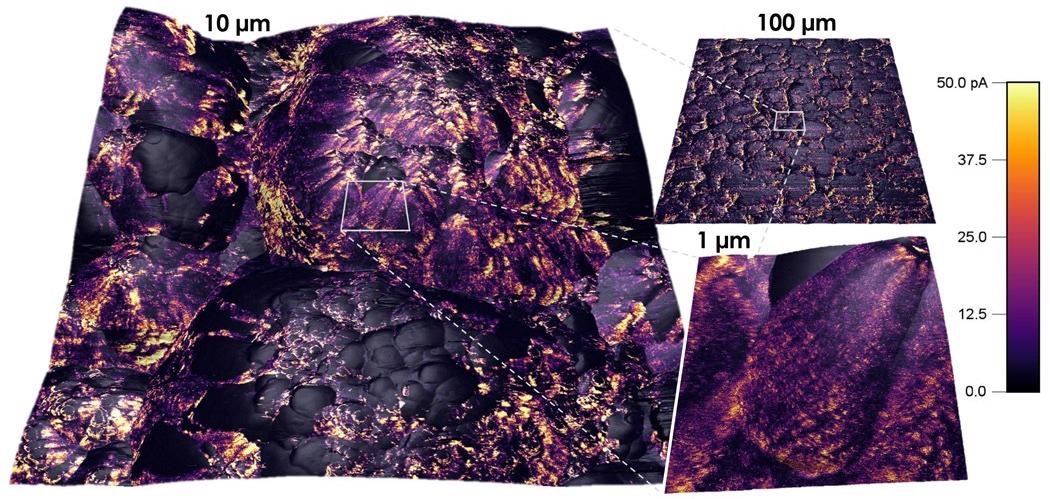
Figure 4. Current measured with conductive AFM overlaid on a 3D rendering of topography of a commercially available Li-ion battery NMC cathode. Image Credit: Asylum Research - An Oxford Instruments Company
It was noted that some grains in the larger boulders did not have conductivity and that the interstitial grooves had higher conductivity when compared to the boulders.
As well as CAFM, further electrical characterization could be carried out utilizing Kelvin Probe Force Microscopy (KPFM) to determine the work function (volta potential) changes of the different sample features.
Scanning Capacitance Microscopy (SCM) could also be employed to chart capacitance and ion-based doping heterogeneity in the sample.
Further characterization options exist, such as nanomechanical imaging modes including Fast Force Mapping (FFM) or AM-FM Viscoelastic Mapping Mode. These can be utilized to visualize nanoscale variations in the following:
- Adhesion
- Dissipation
- Indentation
- Moduli
Nanomechanical Analysis on Polymer-Gel Electrolyte
In another use of ex-situ AFM measurements, researchers assessed various preparations of a hybrid polymer-gel electrolyte material in regards to both lithium salt concentration and acetonitrile as a solvent additive.2
Two sets of data were collected, corresponding to two different electrolyte compositions.
In each data set, a topographic map of the surface structure was acquired, with a corresponding force map where mechanical information had been acquired at every pixel utilizing the AFM probe (Figure 5).
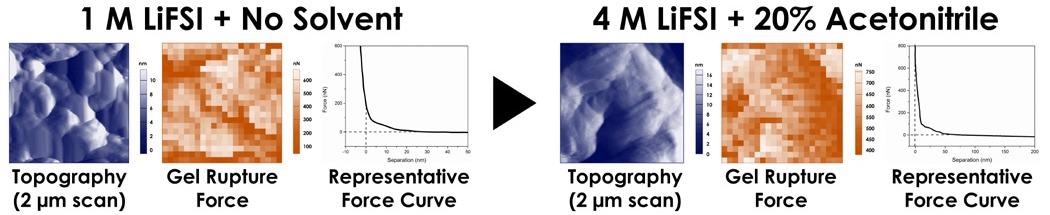
Figure 5. Polymer gel electrolyte morphology and mechanical properties as a function of Li salt concentration (1 M or 4 M) and acetonitrile (present or absent). (adapted from reference 2). Image Credit: Asylum Research - An Oxford Instruments Company
The topographic images evaluate the effect of the different formulations on the morphology of the gel electrolyte. The force maps determine its thickness and mechanical stability by measuring the forces needed to cause the film to rupture.
Plastic deformation noted in these measurements indicated deleterious compositional effects that could lead to crack formation as the strain or volume undergoes change during the lithiation/delithiation process.
AFM measurements assisted the researchers in reaching the conclusion that having high concentrations of lithium salt and the addition of acetonitrile will enhance the Li-ion storage capacity and make the electrolyte gel more stable by giving it greater thickness and flexibility.
In-situ AFM Measurements
An in-situ measurement could involve imaging a liquid-electrode interface. This is the surface where the electrochemical reaction vital to the battery’s functioning will occur under voltage and environmental control.
In-situ measurements are not just applicable in energy storage. These can also be used with biosensors, catalysis and other electrochemical technologies. This is especially important where batteries build up a solid electrolyte interphase (SEI) during the cycling process.
The SEI is a passivating layer that forms on electrode surfaces during battery charge and discharge. It influences the anode and cathode’s interfacial performance, affecting a battery’s discharge kinetics, capacity and long-term stability.
A crucial and all-encompassing aspect of in-situ experiments is that during the relevant electrochemical processes, electrons and ions migrate around, and the electrode surface may also change conformation. The following may also arise:
- Phase separations
- Crystalline lattices
- Different nanostructures
Visualizing SEI Formation
In Li-ion batteries, electrodes are often made from carbon-based materials or composites.
A recent in-situ AFM research project employed the Cypher ES and a modified electrochemical cell to investigate the nucleation and growth of the SEI from 1 M LiPF6 in 50/50 EC/DMC as the electrolyte solution on three different electrodes:
- Highly oriented pyrolytic graphite, (HOPG)
- Non-graphitizable amorphous carbon (Hard Carbon)
- MesoCarbon MicroBeads graphite (MCMB)3
As well as observing that SEI formation happened at separate potentials for each electrode material, the SEI was uniformly deposited on the circular features of the MCMB and Hard Carbon surfaces (Figure 6).
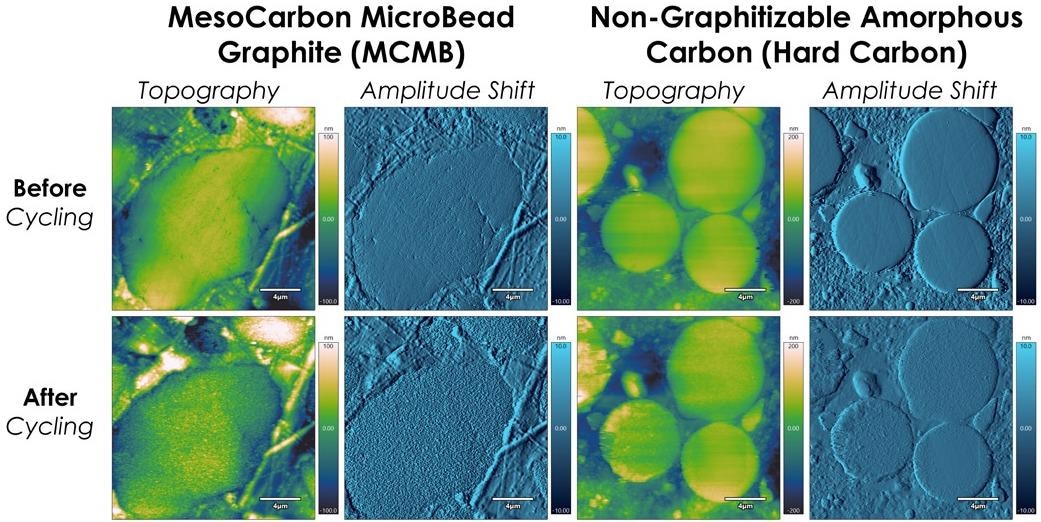
Figure 6. SEI formation on MCMB and Hard Carbon electrodes during in-situ voltage cycling. (adapted from reference 3). Image Credit: Asylum Research - An Oxford Instruments Company
The topography and added roughness in amplitude shift are visible and were preferentially formed at step edges for HOPG. The SEI was found to be stable after the first cycle in each case.
The HOPG electrode displayed blistering, a commonplace effect found in ethylene carbonate (EC) electrolytes with trace H2O molecules that are co-intercalated and then electrolyzed to gas between the graphitic layers.
In a series of 20 µm scans at the start and end and 5 µm scans during a full cyclic voltammogram under these conditions (Figure 7), the SEI initially formed during the sweep to lower voltages (Figure 7A to Figure 7E) and was followed by blistering as the voltage was swept back to higher potentials where the intercalated water molecules are split (Figure 7F to Figure 7I).
It is notable that in the AFM image, the SEI abruptly comes into view while scanning up the image, corresponding to the sharp faradaic current spike during segment D (yellow) in the cyclic voltammogram (Figure 7D).
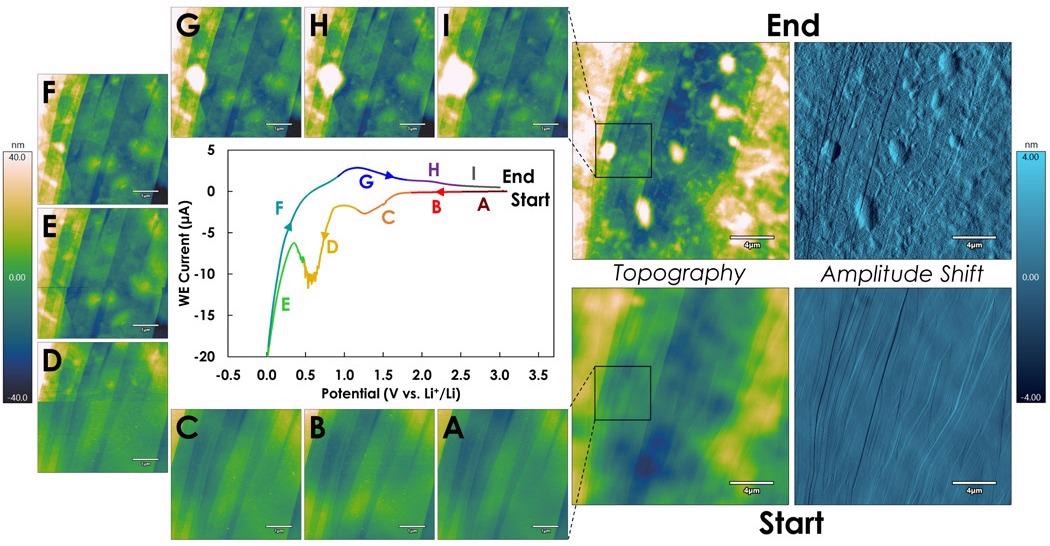
Figure 7. SEI formation during voltage cycling on a HOPG electrode. Colored segments labeled A through I in the central Cyclic Voltammogram correspond to the voltage ranges during which the corresponding images labeled A through I were acquired. (adapted from reference 3). Image Credit: Asylum Research - An Oxford Instruments Company
For the start/end 20 µm scans, the amplitude shift data is also included to illustrate the remarkable change in roughness from the SEI formation during the cycle.
Zinc as an Electrode Material
This in-situ measurement example regards zinc as the negative electrode material in rechargeable batteries. Zinc is widely known as a coating for galvanized nails, where it works as an anode to prevent corrosion of the underlying steel.
Zinc is also presently utilized in single-use zinc-air hearing aid batteries as it has an excellent shelf life, is low in cost and possesses high energy density. These properties make it an attractive negative electrode material for rechargeable batteries.
Making zinc functionally rechargeable requires optimization as it is vulnerable to dendrite or filament formation that can result in catastrophic short circuiting.
A research team from Lawrence Livermore National Lab has characterized the electrodeposition (plating) of polycrystalline zinc from ionic liquid (IL) electrolytes in hopes of enhancing rechargeability.
ILs have been demonstrated to lead to a reduction in Zn dendrite formation.4
Electrodeposition, in particular, denotes the growth of Zn crystals during the charging process for the battery’s negative terminal. Crystal structures would correspondingly dissolve if the battery was discharging.
Repeated cycling would result in the repeated growth and dissolution cycles of these crystal structures.
Zinc film growth was monitored in situ using voltage control in an electrochemical cell inside the AFM. Dry argon gas was passed through the cell in order to remove moisture (Figure 8).
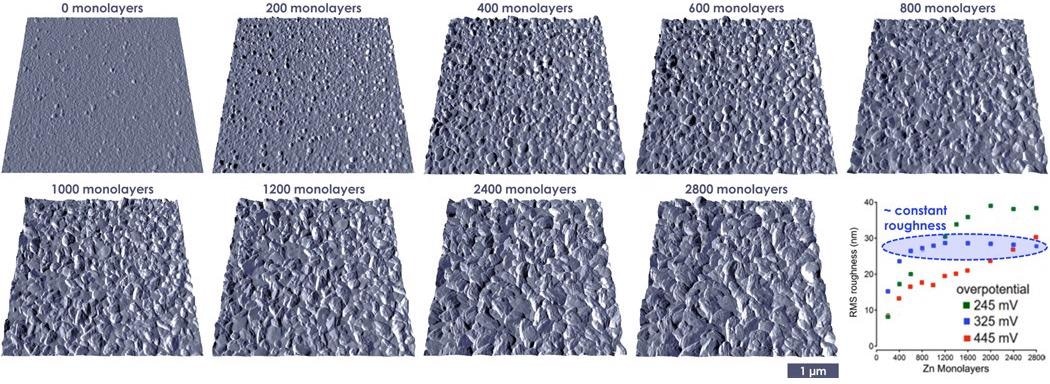
Figure 8. Electrodeposition of polycrystalline zinc from ionic liquid electrolytes onto the negative electrode. (adapted from reference 4). Image Credit: Asylum Research - An Oxford Instruments Company
Film topography (roughness) is seen to generally increase as a function of film thickness (charging time). By varying the applied overpotential between three different voltages (225, 325 or 425 mV), it was noted that film roughness changed as a function of charging time.
At 325 mV overpotential (blue data points), the roughness levels off to a constant value. This indicates that the film is being deposited in a uniform manner and consequently, dendrite formation is mitigated. These ideal nanoscale conditions can be translated to a rechargeable Zn battery operation.
A recent study has assisted in confirming the formation of hexagonal Zn platelets and their growth and coalescence over time.5
The data (not shown here) assisted in interpreting in-situ ultra-small-angle X-Ray scattering (USAXS) data. This data was further corroborated by ex-situ Scanning Electron Microscopy.
This data illustrates the value of AFM for correlating nanoscale measurements - even across measurement platforms - as they offer a more comprehensive account of Zn electrodeposition.
This increases the cyclability of Zn-electrode batteries and makes them increasingly commercially viable.
Ionic Liquid Conformation Changes at a Biased Electrode
Phase mapping is among the most sensitive outputs of tapping mode imaging. Variations in phase are related to variations in the energy dissipated into the sample due to variations in stiffness.
At the sub-micron imaging scale, phase mapping offers up the ability to differentiate chemical moieties in surface-assembled 2D van der Waals adlayers and molecular crystals.
ILs have gained interest in terms of battery electrolytes usage for a number of factors. These include:
- Their low volatility
- Their high thermal stability
- Their high conductivity
- Their large electrochemical stability windows
ILs are comparatively large (approximately 1 nm in size), polar, organic molecules. They do not perform like conventional salt solutions, particularly at the electrode interface, which can affect device performance. Ionic liquids are believed to be molecularly templated at surfaces, indicating that they form well-ordered Stern layers.
One study saw researchers utilize the intense sensitivity of phase mapping to assess the molecular ordering properties of an IL called 1-ethyl-3-methylimidazolium bis(trifluoromethylsulfonyl)imide (EMIm+ / TFSI-) at a biased graphite electrode.6
The measurements obtained at this scale offered a view into phenomena that may transpire at the initial atomic or molecular layers close to the cathode or anode surface inside of a battery during charging or discharging.
The subsequent data allowed direct visualization of the molecular ordering on a graphite surface due to Cypher’s ultra-high-resolution capabilities, as can be seen from the scale bars (Figure 9).
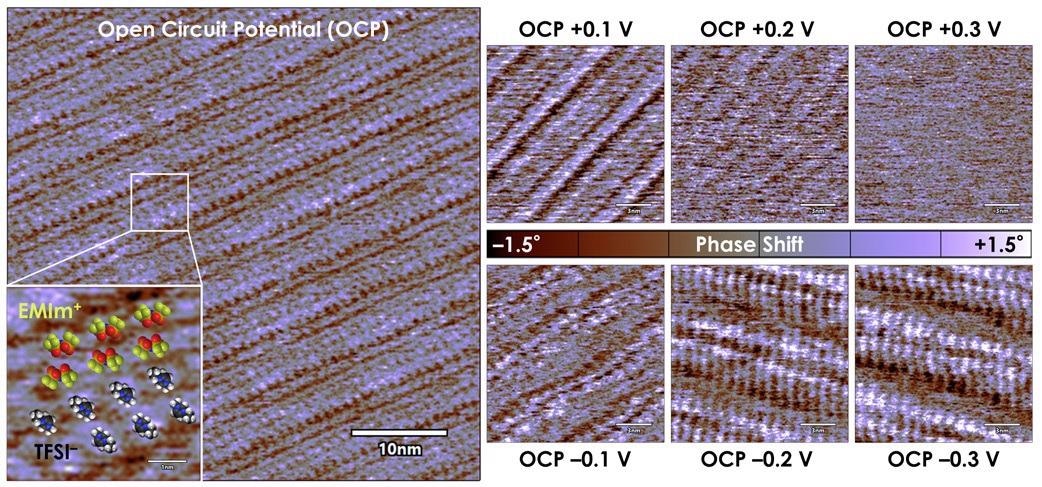
Figure 9. As seen with tapping mode phase mapping, applying a potential to the graphite electrode surface significantly alters the EMIm+ / TFSI– ionic liquid Stern layer nanostructure. (adapted from reference 6). Image Credit: Asylum Research - An Oxford Instruments Company
By utilizing a potentiostat and electrochemical cell, the potential at the graphite electrode surface can be varied. The Stern layer was observed to significantly alter its structure as it compensated for interfacial charge, meaning:
- The surface is enriched with anions at positive potentials
- The surface is enriched with cations at negative potentials
- The ionic liquid molecules rearrange to make space for these ions as they migrate to the surface
The molecular ordering with no applied bias (open circuit potential) is apparent, showing the regular patterning of EMIm+ and TFSI- (Figure 9, far left).
Structural rearrangements and even loss of order are evident as the magnitude of applied voltage increases (Figure 9, right):
- In the top row, as the applied voltage increases to +300 mV above open circuit, the structural order completely disappears
- A -300 mV bias changes the periodicity of the Stern layer
These molecular scale phenomena may also occur at electrodes in newer battery technologies such as Redox Flow Batteries.
In these batteries, soluble redox-active organic molecules in solution and outer-sphere electron transfer to metal ions and allow energy to be stored in reservoirs of liquid rather than through stripping, plating or ion intercalation into solid materials.
The Stern-layer data will undoubtedly have implications for interfacial charge transfer that will affect battery operation.
Separator Correlative Mapping
Many batteries will need a separator - or ion-conducting membrane - between the materials on the negative and positive terminals. Separators inhibit chemical crossover between terminals but result in increased cost and increased internal resistances in practical devices.
Internal resistance is often associated with the chemical moieties of the material and its molecular structure and the resulting ionic conductivity.
AFM phase mapping is an ideal imaging technique, due to its sensitivity, for the analysis of the separator microstructure. This is because the hydrophobic and hydrophilic domains possess different energy dissipation levels and, therefore, different phase responses.
One study saw researchers utilize electrostatic force microscopy (EFM) and phase mapping to establish that separators with fibers parallel to the plane of the separator have a greater EFM response and less ionic conductivity and connectivity.
Separators with perpendicular fibers showed less EFM response and greater ionic conductivity and connectivity.7
A second study saw the same researchers utilize a similar, commercially available ion exchange membrane. In this study, researchers time correlated its topography in hydrated and dehydrated states to electrical conductivity that corresponded to the transference of hydroxide ions via ion channels.8
To obtain measurements, a membrane electrode assembly (MEA) was placed inside an MFP-3D AFM closed cell that allowed for air and hydrogen gas flow, temperature control, and bias inside the cell for in-situ testing. This was sealed with a membrane around the cantilever holder (Figure 10).
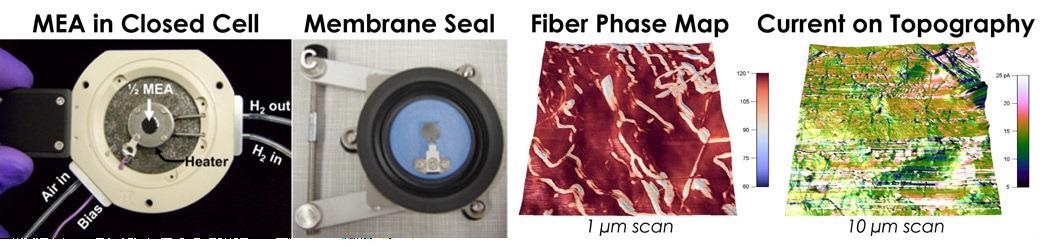
Figure 10. Phase and Conductive AFM mapping on a wetted anionic exchange membrane separator. (adapted from reference 8). Image Credit: Asylum Research - An Oxford Instruments Company
The AFM tip can detect nA-scale currents from ionic flows via conducting channels in the separator.
In dehydrated conditions, the AFM phase images showed that few hydrophilic domains existed due to a lack of water retention from the hydrophobic nature of the polymer. This meant that the separator would be poorly conductive.
As hydration increases, the phase maps displayed a surface structure change in which randomly isolated and dispersed fibrillar hydrophilic domains were found - a positive result.
Conductive AFM measurements discovered that the increase in hydrophilic domains did not lead to an increase in conductivity, however.
These elongated structures were insulating, indicating that the membrane’s high water content induced excessive swelling and surface rearrangement but not ion conductance (Figure 10, Current).
These findings impact the choice of separator chosen to be employed inside a battery.
Operando Imaging of the Positive Terminal of an LI-Oxygen Battery
Lithium-oxygen batteries highlight the complex and difficult nature of measuring an operating battery with extremely sensitive chemistry to its maximum. If such a battery were to be optimized, it would likely be implemented in fast-charging devices, long-range cars and high-performance applications.
In this study, the Li-O2 battery was put together within the AFM so that the positive electrode surface - glassy carbon - was accessible by the AFM probe in a 1-meter LiNO3 tetraglyme electrolyte. The sealed sample chamber of the Cypher ES AFM was then purged with pure oxygen gas.9
The oxygen gas flow was exceptional as the AFM was operating inside an argon-filled glovebox and vitally did not escape into the glovebox atmosphere due to the Cypher ES sample cell’s hermetic seal.
Tapping mode topography data corresponding to a full discharge-charge cycle of the lithium-oxygen battery was obtained (Figure 11).
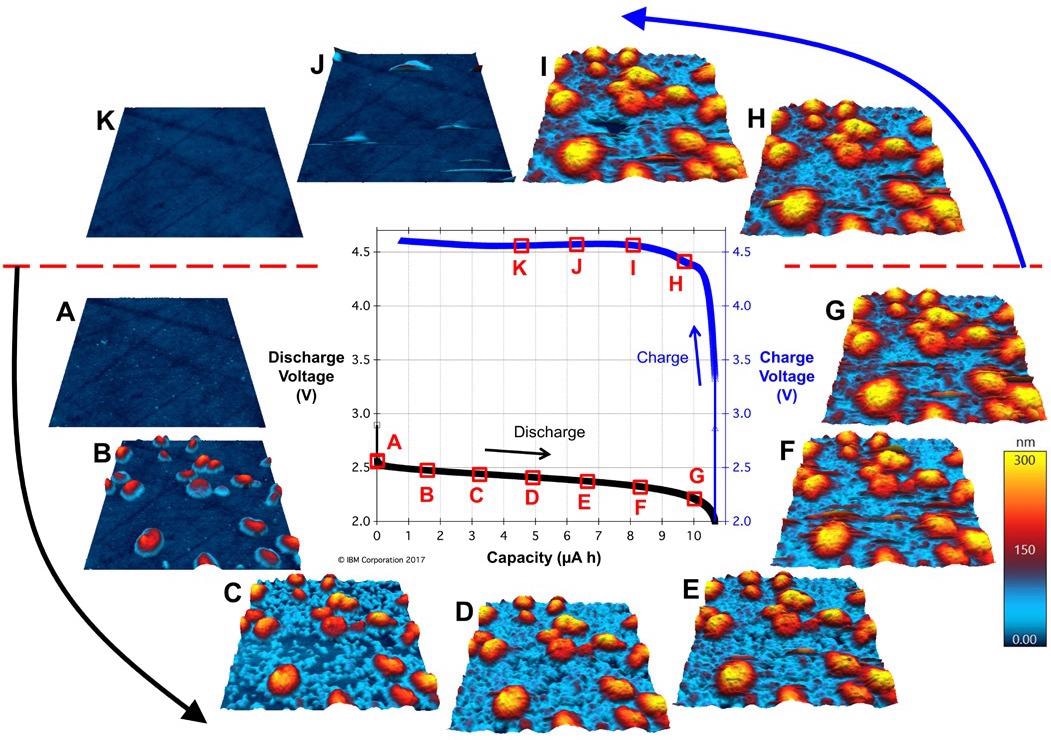
Figure 11. Operando imaging of mixed-valence LiOx deposits on the glassy carbon positive electrode during a full charge/discharge cycle of a Li-O2 battery. (adapted from reference 9). Image Credit: Asylum Research - An Oxford Instruments Company
The negative electrode comprised solid lithium metal, while the positive electrode comprised polished glassy carbon. The oxygen reacted during discharge, and the AFM probe was scanning to acquire images of the Li-O2 reaction products.
The current was controlled to 2 μA during the charging and discharging sections of the cycle. This corresponded to a full cycle time of just over 10 hours. The AFM imaging was stable throughout.
A plot of the battery’s capacity versus output voltage during the cycle can be seen at the center. Around the outside are 3-micron AFM topography images acquired during the cycle, known as operando imaging.
As the battery discharges (Figure 11A to Figure 11G), the lithium atoms oxidize and become mobile within the solvent. A mixed-valence lithium-oxygen (LiOx) solid-electrolyte interphase material nucleated, developed and coalesced into a conformal coating on the glassy carbon (seen as red-yellow structures in the AFM images).
On charging, the structures initially endure but subsequently begin to dissolve until finally disappearing when a 50% state of charge is reached at point K (Figure 11H to Figure 11K).
One crucial inference is that the coalesced LiOx discharge layer is structurally stable during discharge and totally dissolves during subsequent charging. This signifies that this battery should be highly cyclable.
AFM was the primary way to view the structural evolution and persistence of the layer during the battery’s operation.
CO2 Catalysis at a Copper Electrode
Although a divergence from batteries, this study remains relevant as a driven electrochemical process was being monitored in an operating catalytic cell inside the AFM.
Though not strictly an energy storage device, it represented a form of energy storage as electrons are being utilized for reductive chemical bond formation that is organically extensible to the charge-discharge energy conversion phenomena at battery electrodes.
After the surface was wetted with electrolyte, it rapidly formed epitaxial copper-oxide platelet structures with hexagonal symmetry.10
Even in such an advanced experimental system, the Cypher ES AFM maintained its ultra-high resolution. It mapped the atomic lattice of the Cu-oxide platelets and revealed their rhomboidal unit cell and hexagonal periodicity (Figure 12A).
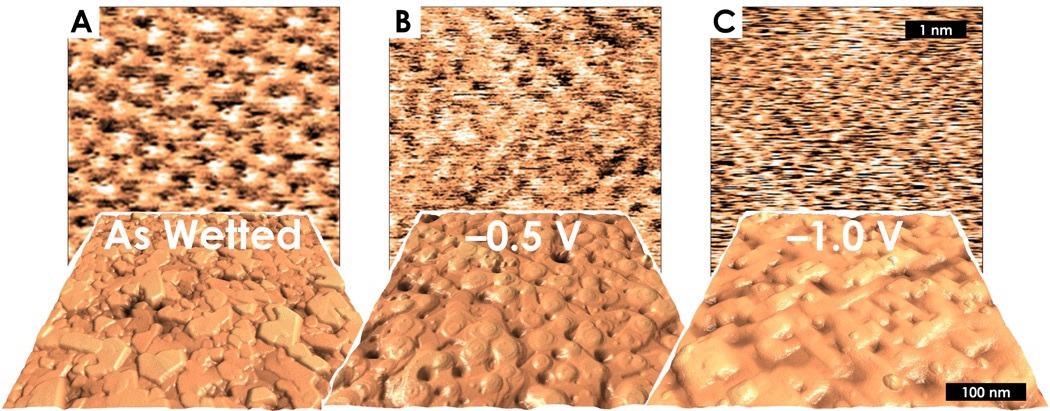
Figure 12. In-situ voltage-dependent atomic and sub-micron morphology of crystalline Copper during catalytic CO2 electroreduction. (A) Cu2O(111) platelets and atomic resolution in the as-wetted state at open circuit potential. (B) “Mound-pit” topography and 2x2 lattice structure at –0.5 V. (C) “Straight terrace” topography and 1x1 lattice structure at –1.0 V. (adapted from reference 10). Image Credit: Asylum Research - An Oxford Instruments Company
A potentiostat was then utilized to modulate the applied voltage and drive CO2 reduction. As the applied voltage became increasingly negative, the surface topography of the copper transitioned.
It went from as-wetted platelet structures to a mound-pit structure with round edges at -0.5 V and subsequently to a straight terrace structure with 90-degree angles as the voltage was brought down to -1.0 V (Figure 12B and Figure 12C).
The resulting crystalline facets displayed a remarkable atomic structure transition, where there appeared to be a molecular carbon-monoxide adlayer making a 2x2 structure at -0.5 V. The atomic structure returns to 1x1 at -1.0 V (Figure 12B and Figure 12C).
These experimental conditions also evolved gas owing to water hydrolysis. Despite the development of gas bubbles, the AFM was still able to acquire ultra-high-resolution images.
The findings reveal the complex interaction between catalyst preparation and handling, defect density and nature, structure and morphology, applied potential, and electrolyte.
It is frequently believed that the surface is metallic copper under CO2-reducing conditions, but the study indicates that oxides, surface reconstructions and even molecular adlayers at relevant applied potentials must be taken into account to establish catalyst structure-property relationships.
The voltammetric behavior of the copper surface was also nanostructure sensitive, and the operando results were the only way to confirm this phenomenon. It can be anticipated that such data and nanoscale transformations will have analogs in other catalytic and electrochemical systems.
Conclusion
This article outlined a small selection of ways in which AFM can be used to characterize electrochemical interfaces and batteries by means of in-situ, ex-situ and operando measurements.
An important finding of the article is that Asylum Research’s AFMs are an exceptional and flexible tool for characterizing the reactive interfaces and individual components within batteries.
Experiments can be carried out with voltage control, within an electrochemical cell housed in the AFM, and additionally environmentally controlled by employing a glovebox due to the outstanding low noise and stability qualities of the Cypher ES AFM.
An AFM facilitates insight into morphology, roughness, molecular ordering, mechanical criteria, and other variables that may be crucial in monitoring reaction progress, optimizing reaction conditions and interfacial charge transfer, or even just qualifying battery components before assembly.
References
- https://www.statista.com/statistics/1103218/global-battery-demand-forecast/
- Lahiri, A., Pulletikurthi, G., Shapouri Ghazvini, M., Höfft, O., Li, G., & Endres, F. (2018). Ionic Liquid– Organic Solvent Mixture-Based Polymer Gel Electrolyte with High Lithium Concentration for Li-Ion Batteries. The Journal of Physical Chemistry C, 122(43), 24788-24800.
- Luchkin, S. Y., Lipovskikh, S. A., Katorova, N. S., Savina, A. A., Abakumov, A. M., & Stevenson, K. J. (2020). Solid-electrolyte interphase nucleation and growth on carbonaceous negative electrodes for Li-ion batteries visualized with in situ atomic force microscopy. Scientific reports, 10(1), 1-10.
- Keist, J. S., Orme, C. A., Wright, P. K., & Evans, J. W. (2015). An in situ AFM study of the evolution of surface roughness for zinc electrodeposition within an imidazolium based ionic liquid electrolyte. Electrochimica Acta, 152, 161-171.
- Keist, J. S., Hammons, J. A., Wright, P. K., Evans, J. W., & Orme, C. A. (2020). Coupling in situ atomic force microscopy (AFM) and ultra-small-angle X-ray scattering (USAXS) to study the evolution of zinc morphology during electrodeposition within an imidazolium based ionic liquid electrolyte. Electrochimica Acta, 342, 136073.
- Elbourne, A., McDonald, S., Voichovsky, K., Endres, F., Warr, G. G., & Atkin, R. (2015). Nanostructure of the ionic liquid–graphite stern layer. ACS nano, 9(7), 7608-7620.
- Barnes, A. M., Du, Y., Liu, B., Zhang, W., Seifert, S., Coughlin, E. B., & Buratto, S. K. (2019). Effect of Surface Alignment on Connectivity in Phosphonium-Containing Diblock Copolymer Anion-Exchange Membranes. The Journal of Physical Chemistry C, 123(51), 30819-30826.
- Barnes, A. M., Liu, B., & Buratto, S. K. (2019). Humidity-dependent surface structure and hydroxide conductance of a model quaternary ammonium anion exchange membrane. Langmuir, 35(44), 14188-14193.
- Virwani, K., Ansari, Y., Nguyen, K., Moreno-Ortiz, F. J. A., Kim, J., Giammona, M. J., ... & La, Y. H. (2019). In situ AFM visualization of Li–O2 battery discharge products during redox cycling in an atmospherically controlled sample cell. Beilstein journal of nanotechnology, 10(1), 930-940.
- Simon, G. H., Kley, C. S., & Roldan Cuenya, B. (2021). PotentialDependent Morphology of Copper Catalysts During CO2 Electroreduction Revealed by In Situ Atomic Force Microscopy. Angewandte Chemie International Edition, 60(5), 2561-2568.

This information has been sourced, reviewed and adapted from materials provided by Asylum Research - An Oxford Instruments Company.
For more information on this source, please visit Asylum Research - An Oxford Instruments Company.