Sponsored by Nanosurf AGReviewed by Olivia FrostJan 20 2023
Normal alkanes CnH2n+2 are extended linear chain molecules that form ordered lamellar structures and crystals. When the size of the chains reaches n > 120, such ultra-long alkanes manifest chain folding, which is the primary cause of polymer crystallization.
C390H782 is the longest alkane with a perfect linear polyethylene model and has many distinct features.
The lamellar 2D organization is present in thin and ultra-thin layers of alkanes on highly oriented pyrolytic graphite (HOPG) and other layered crystals such as MoS2. The molecular orientation on these substrates exhibits three-fold symmetry, guiding the related orientation of the alkane lamellae.
As the lamellae are composed of elongated chains, their width equals the alkane length when the molecules are aligned perpendicular to the lamellar edges.
The length of different alkanes varies from C18H38 to C390H782, as do many linear chain molecules, which are typically extended and form ordered lamellar structures and crystals, as listed in Figure 1a.
The lamellar width can be reduced when molecules are angled at lamellar edges. Figure 1b depicts a sketch of the alkane lamellae, which should have the thickness of an individual alkane molecule (0.5 nm).
AFM images at room temperature can disclose the lamellar order of all these alkanes on HOPG, as the melting temperature of C18H38 crystals is around 28-30 °C, and longer alkanes melt at higher temperatures.
Lamellar ordering of alkanes, which is enhanced by intermolecular interactions on atomically flat surfaces like HOPG, is known to be maintained at temperatures above the melting temperature of alkane crystals.
This can be verified by the detection of C390H782 lamellar layers on HOPG at temperatures 50 °C above the melting temperature of these alkanes (130 °C).1
The lamellar edges are generated by -CH3 end groups, which are bulkier than -CH2 groups of the chains. The related changes in height are reflected in the topography of lamellar sheets generated on atomically flat substrates.
In this article, the use of AFM to observe the lamellar structures of normal alkanes with different chain lengths on HOPG is demonstrated.
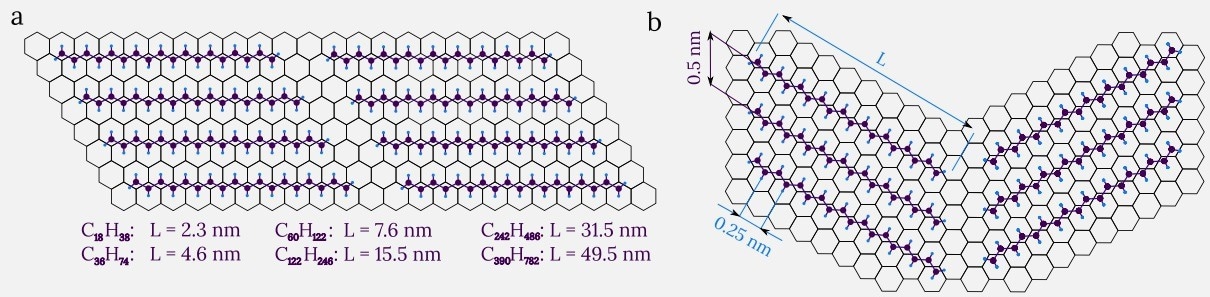
Figure 1. Self-organization of normal alkane molekules (CnH2n+2) on HOPG surface. The HOPG surface is depicted as a honeycomb lattice, the carbon atoms are dark purple circles and the hydrogen atoms are light blue circles. (a) Horizontal packing with molecular chains in different lamellae parallel to each other. (b) V-shaped packing, with the molecules in different lamellae positioned at an angle to each other. The text below the sketch (a) indicates lengths L of alkane molecules of different molecular weights. Image Credit: Nanosurf AG
Experimental Details
The samples of various alkanes were prepared by spin-casting their solutions in toluene (concentration of roughly 10 mg/ml) on a freshly cleaved HOPG surface.
All AFM measurements were performed at room temperature. In most cases, DriveAFM was used in dynamic mode using photo-thermal excitation of the cantilever (CleanDrive) instead of a piezo-electric drive.
Some experiments were also conducted in WaveMode, where the cantilever photothermally oscillated off-resonance at a frequency of 3 kHz. Commercially available soft dynamic mode cantilevers with spring constants ranging from 1 to 10 N/m were applied in these experiments.
Imaging of C60H122
Figures 2a-2d depict the visualization of the lamellar arrangement of normal alkane C60H122 with a molecular length of 7.5 nm. Figure 2a depicts a 1 µm wide area with multiple terraces covered by scarcely visible fine linear features. Several nanoscale-size droplets represent alkane material that was not dispersed across the substrate.
A recurring pattern with 7.5 nm spacing is revealed by the height image obtained at a smaller location in the center. Figure 2c-2d presents height and phase images in a location with two HOPG crystalline terraces displaying the recurring arrays of linear features with distinct orientations.
The width of these features matches the C60H122 length, allowing them to be assigned to alkane lamellae. The height depressions observed perpendicular to the lamellar edges on the lower terrace are ~0.2 nm in height.
These characteristics can be assigned to -CH3 terminals, which are slightly higher than -CH2- groups. However, the chain end -CH3 groups are more mobile than chain -CH2- groups, and they can be depressed more strongly by the probe tip. The phase contrast in Figure 2d is most likely caused by local stiffness variations.
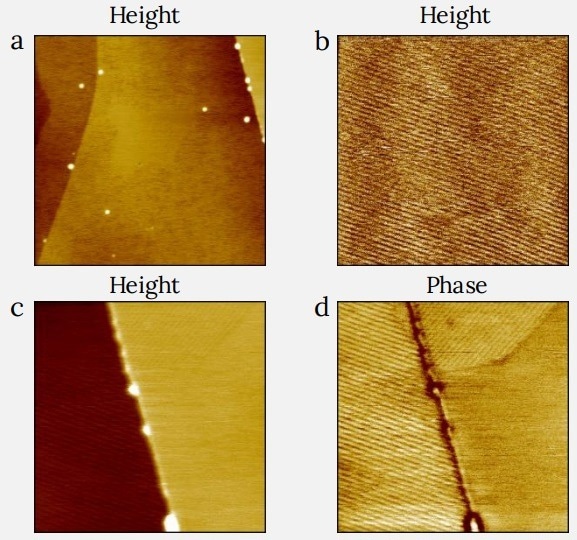
Figure 2. Height (a,b,c) and phase (d) images of C60H122 layer on HOPG. (a) Terraces of HOPG with fine line features representing the alkane assemblies, small droplets are likely the alkane material, not spread on the surface. (b) Zoom in the center of the image (a) showing a periodic pattern of alkane assemblies with the period of 7.5 nm. (c,d) Height and phase images showing two HOPG crystalline terraces with the arrays of linear features with different orientations. (a) Image size: 1 x 1 μm2, height range: 2.4 nm. (b) Image size: 0.4 x 0.4 μm2 , height range: 0.1 nm. (c,d) Image size: 0.4 x 0.4 μm2, height range: 1.8 nm, phase range 48°. Image Credit: Nanosurf AG
Imaging of C122H246
Multiple lamellar sheets of C122H246 alkanes cover the surfaces of two substrate terraces separated by a diagonal boundary displayed in the height image of Figure 3a. At 1 µm scan size, wavy structures of 15-16 nm width are visible at the top part of the image, as illustrated in Figure 3b.
This width is close to the molecular length of C122H246, indicating that they are C122H246 lamellae. The elevated ribbon with a height of 3.5 nm was produced by the strips with identical widths (Figure 3e).
The ribbon was made up of several overlaying strips arranged like the wavy structures that occupied most of the region. Several dark blocks ~15-16 nm in width represent the missing lamellae.
The terraces of several overlaying alkane lamellae visible on the left from the border in Figure 3a are displayed in the height image in Figure 3c. The distance between the top layers is ~0.5 nm, which corresponds to the diameter of individual alkane molecules (Figure 3e).
The faint ribbon-like contrast in this image suggests a regular surface order with the periodic spacing close to the alkane width. The tip-sample force interaction was increased by lowering the set-point amplitude to enhance structure visibility.
The related result is visible in the height image in Figure 3d, which was obtained during the scanning from the top.
Scanning was performed at a low tip force at the top. The height contrast was drastically increased once the tip force increased.
The linear features were resolved at 15-16 nm spacing and at lower periodicities. This observation was confirmed near the bottom of the image, where the set point was raised and then dropped for some scan lines. The related image changes have supported the effect.
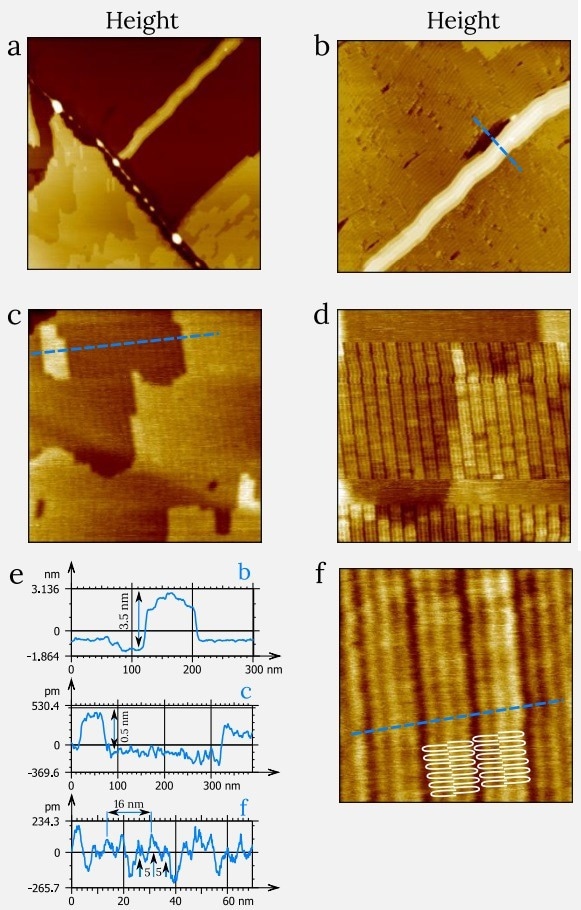
Figure 3. Height images of C122H246 layer on HOPG. The low tip-force interactions were used for images in (a)-(c). The image in (d) was recorded at low and high tip-forces: the scanning started at the top of the image at low force, later the force was increased, and the visibility of lamellar structures has improved. (e) The cross-sections along the blue dashed lines in images (b,c,f). (f) A tentative pattern of lateral chain folding was overlayered on the height image. (a) Image size: 1.5 x 1.5 μm2, height range: 7 nm. (b) Image size: 1 x 1 μm2, height range: 5 nm. (c) Image size: 0.5 x 0.5 μm2, height range: 3 nm. (d) Image size: 0.3 x 0.3 μm2, height range: 1.2 nm. (f) Image size: 76 x 76 nm2, height range: 0.5 nm. Image Credit: Nanosurf AG
The image pattern shown by high-force imaging can be explained by the double folding of alkane molecules, which results in the appearance of an additional 5 nm spacing. Figure 3f depicts this condition.
Imaging of C242H486
Figure 4a depicts a C242H486 adsorbate on HOPG with smooth areas covering the substrate terraces and a few elevated droplets of the alkane not dispersed across the substrate. Figure 4b shows a weak striped pattern on smooth areas, which is more prominent in the height image of a smaller location.
The white lines of around 5 nm width and ~0.2 nm height are most likely the lamellar edges generated by terminal -CH3 groups. The separation of lines of ~30 nm fits the length of C242H486 chains, which confirms the attribution. This image was captured with low tip-sample forces.
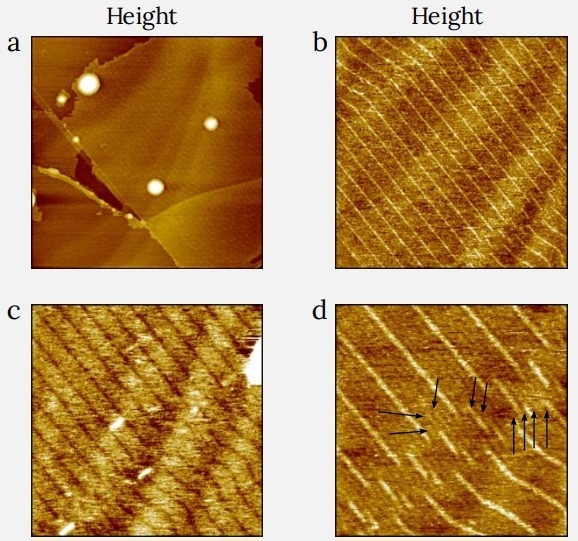
Figure 4. Height images of C242H486 layer on HOPG. The images in (a), (b) and (d) were obtained at low force, and the image in (c) - at higher tip-force. Arrows in (d) point out the fine sub-lamellar features most likely caused by lateral chain folding. (a) Image size: 1.5 x 1.5 μm2, height range: 11 nm. (b) Image size: 0.5 x 0.5 μm2, height range: 0.25 nm. (c) Image size: 0.4 x 0.4 μm2, height range: 0.3 nm. (d) Image size: 0.2 x 0.2 μm2, height range: 0.25 nm. Image Credit: Nanosurf AG
Figure 4c depicts the striped pattern with depressed lines at greater forces. This difference in contrast can be explained by the tip-induced depression of the lamellar edges created by -CH3 terminal groups.
A few short bright rods are also seen on the lamellar surface. They can be allocated to individual alkane chains that were not incorporated into the lamellar layer.
Figure 4d shows fine lamellar features discovered where the lamellar order was disrupted. In addition to the shift of white lines of the lamellar borders, there are weak features with smaller spacings at some locations inside individual lamellae.
These features are indicated with black arrows and are separated by ~6 nm. As a result, lateral folding of C242H486 chains is feasible.
Imaging of C390H782
Folding of macromolecules is frequent for single crystals of ultra-long alkanes, and folding of the C390H782 chain into five segments results in 10 nm thick lozenge-type crystals of this alkane. A chain folding of flat-lying C390H782 chains, which occurs at a few surface locations, has only been reported once.
Figure 5a depicts the surface morphology of the C390H782 layer on HOPG. Many dark and bright blocks with side dimensions close to 49.5 nm (length of C390H782 alkane) have been discovered on this surface.
This hints at the top layers’ lamellar arrangement. The height image of a smaller area (Figure 5b) exhibits bright features that can be ascribed to the boundaries of lamellae of varying size and orientation. The top layer is not complete, and there are multiple dark vacancies with lamellar dimensions on the surface.
Precise details of the lamellar order were visualized by imaging at raised tip forces. The height and phase images taken under these conditions indicated depressed lamellar borders, as seen in Figures 5c and 5d. The distance between the bright and dark lamellar edges is close to 49 nm implying only a minor chain tilt with the borders.
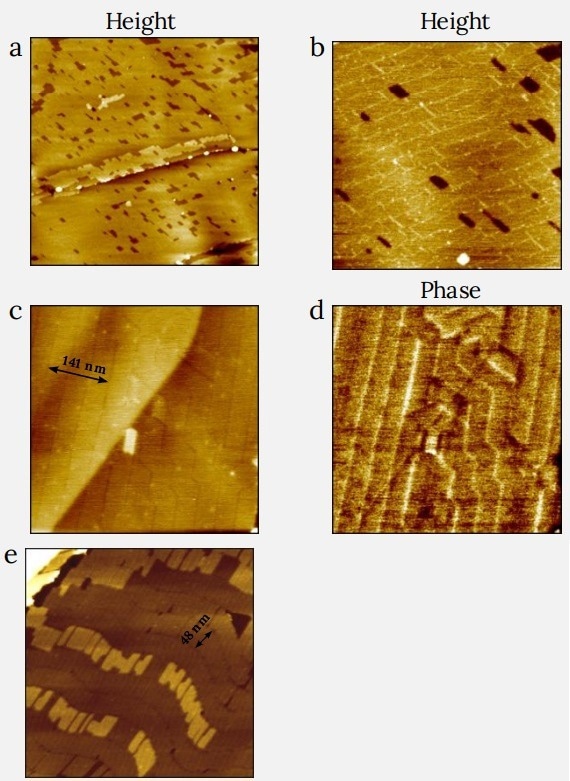
Figure 5. Height (a,b,c,e) and phase (d) images of C390H782 adsorbate on HOPG. The images in (a)-(d) were recorded in dynamic mode in low-force (a-b) and high-force (c-d) operations. The image in (e) was obtained in WaveMode. The inserts in (c) and (e) indicate the width of three and one lamellae, respectively. (a) Image size: 2 x 2 μm2, height range: 2 nm. (b) Image size: 0.6 x 0.6 μm2, height range: 0.7 nm. (c,d) Image size: 0.5 x 0.5 μm2, height range: 0.7 nm, phase range: phase range 5°. (e) Image size: 0.5 x 0.5 μm2, height range: 4.5 nm. Image Credit: Nanosurf AG
Fine details in the curved lamellar ribbons were observed in the WaveMode height image in Figure 5e. This off-resonance mode has a stronger tip-force interaction compared to Dynamic Mode. As a result, additional structural features can be visualized.
The curved lamellar ribbons’ boundaries have a darker contrast, and individual ribbons include multiple lines with spacings as small as 10 nm that are perpendicular to the boundaries.
The top ribbons epitaxially formed on the underlying lamellae can be divided into distinct blocks of extended chains. A few dark voids with similar dimensions are also seen on the surface.
Conclusion
AFM analyses of conventional and ultra-long alkanes on HOPG indicate a collection of fine structural features related to lateral chain folding and lamellar arrangement. These nanoscale structures formed on atomically flat surfaces can be exploited to gain better knowledge of alkane and polymer crystallization.
Acknowledgments
Sergei Magonov, SPM LABS LLC, USA prepared the measurements and text of this article.
References
- Zhang, R. et al., Nature Comm. 12 (2021) 1710

This information has been sourced, reviewed and adapted from materials provided by Nanosurf AG.
For more information on this source, please visit Nanosurf AG.