Yan Wang, Carl Schuurmans, Bas Evers, Jan-Piet Wijgergangs, Nick Koumakis, Michiel Hermes, Ad Gerich, Rut Besseling.
Problem statement
The size and size distribution of nanomedicines in various (bio)pharmaceutical products, including liposomes, lipid nanoparticles, recombinant proteins, and antibodies, plays a significant role in their pharmacokinetic and pharmacodynamic profile in vivo. These factors directly influence therapeutic efficacy, immunogenicity, and safety1,2. Consequently, particle size is considered one of the critical quality attributes for such products.
Significant challenges in manufacturing biopharmaceuticals are the precise control and monitoring of the process3. For size monitoring, standard sizing methods such as Dynamic Light Scattering (DLS) are typically unable to perform continuous, inline measurements during processing. Thus, during manufacturing, samples must be extracted from each batch and sent to separate laboratories for preparation and analysis before proceeding to the subsequent operation. This approach fails to provide a comprehensive understanding of the influence of process parameters on size characteristics of e.g. lipid nanoparticle and protein formulations. Moreover, the sampling and testing procedures lead to inefficient formulation development, while in manufacturing they can cause delays between batch production and approval/clearance. This prolongs the drug product’s supply chain and makes it more challenging to quickly respond to sudden changes in demand. Additionally, sampling, sample preparation, and offline measurements generally have the risk to affect drug product characteristics and provide unrepresentative size data, which could lead to inconsistent product quality.
Solution
According to Quality by Design (QbD) principles in pharmaceutics, quality should be intentionally designed into a product by assessing the influence of process parameters and material attributes on the final product's quality4. QbD provides a deeper understanding of the manufacturing process and crucially relies on the integration of Process Analytical Tools (PAT) to monitor the process. PAT enables a systematic and science-based approach to pharmaceutical manufacturing, supporting QbD. It enhances process understanding, facilitates risk assessment and management, enables real-time monitoring and control, and contributes to continuous improvement and regulatory compliance.
To facilitate QbD, InProcess-LSP has developed novel ‘Spatially Resolved Dynamic Light Scattering’ (SR-DLS) instrumentation5–7. In contrast to standard DLS, SR-DLS simultaneously resolves light scattering signals from different depths (slices) in the sample, with a few µm resolution, up to several mm total depth. Along with patented analysis methods, SR-DLS opens up a large range of new nanoparticle sizing opportunities, with one of the most significant advantages over standard DLS being the ability to measure particle size in flow. SR-DLS -implemented in the ‘NanoFlowSizer’ (NFS) products- thus allows inline size characterization of nano(medicine)-suspensions in industrially relevant flows, enabling its use as PAT method for a broad range of (pharmaceutical) nanosuspension manufacturing processes.
For a number of bio-pharmaceutical suspensions introduced above, a challenge for ‘standard’ SR-DLS monitoring (using the NFS-Fides system) is the relatively low turbidity that these suspensions may exhibit, due to very low concentration, small size, or low scattering efficiency of particles. To address this and enable process monitoring of such low turbidity formulations, InProcess-LSP has developed a novel SR-DLS system, the NFS-Thalia, with significantly improved detection of low scattering signals. The NFS-Thalia offers exceptionally high sensitivity, allowing for real-time inline size measurements of formulations even at very low turbidity levels. With this system, PAT nanoparticle sizing capabilities -and the associated benefits for efficiency, understanding, and quality of the process- are extended to the processing of e.g. protein or low-concentration lipid-based formulations.
Results
This application note highlights two distinct low turbidity applications in the field of biopharmaceutics that benefit from the NFS-Thalia system for particle size measurements. The first application involves the assessment of particle size in continuous liposome manufacturing with low lipid concentrations, below 3 mg/mL, while the second application focuses on measuring sub-10 nm albumin proteins under flow.
Monitoring Liposome Suspensions
In the first application, liposomes were produced utilizing the LARU (Lab and Research Unit) system (Fig. 1), a bench-top continuous nanoparticle manufacturing system developed by DIANT Pharma Inc., using an ethanol injection method. In this method, a lipid mixture comprising cholesterol and distearoylphosphatidylcholine dissolved in ethanol was combined with water using a single turbulent jet mixing approach. The flow rate ratio of the lipid mixture to water was set at 1:7 v/v, with a total flow rate of 160 mL/min. The resulting liposomes had a final lipid concentration of 2.84 mg/mL and an ethanol content of 12.5%. Subsequently, the resulting liposomes were passed through a 0.5-inch inner diameter NFS flow cell (connected via an adaptor to the NFS probe unit, inset to Fig 1.), where they were characterized in flow in real-time using the NFS-Thalia system. For proper size characterization, both the suspension temperature and solvent viscosity were taken into account.
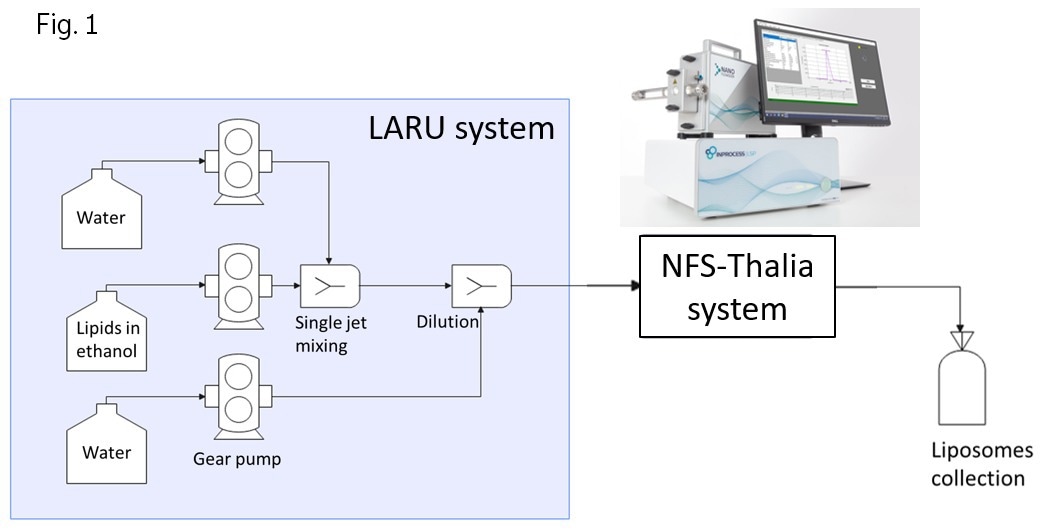
Figure 1. Schematic illustration of liposome manufacturing using the LARU system combined with in-process continuous size characterization using the NFS-Thalia. Image Credit: InProcess-LSP
Using the dedicated flow-correction algorithms to extract particle size info from the SR-DLS data, inline sizing of the liposomes could successfully be performed even at the very significant flow rate of 160ml/min. As shown by the continuous monitoring data in Fig. 2A (one measurement every ~7s), the liposomes exhibited a hydrodynamic diameter (Cumulant Z-av size) of 72±1 nm, with a deviation of less than 2%, and a low polydispersity index (PDI) of 0.11±0.02. The collected liposome suspension with a final lipid concentration of 2.84 mg/mL was subsequently measured under static conditions in an NFS vial module as a control (using the same NFS-Thalia system). The results in Fig. 2B show that these offline measurements yield a Z-av particle size and polydispersity index identical to the inline measurements, independent of lipid concentration down to a concentration of 0.02 mg/mL.
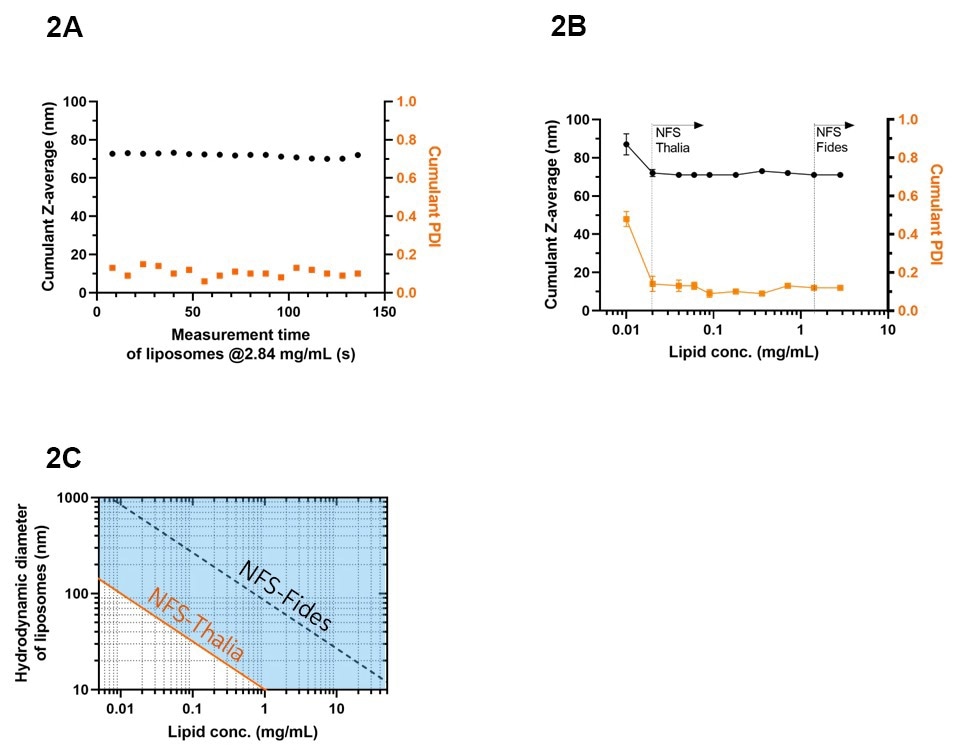
Figure 2. Size characteristics of liposomes using NFS-Thalia as measured inline and offline. (A) Inline Cumulant Z-av size and PDI during manufacturing with the LARU system, using the 0.5-inch flow cell module at a flow rate of 160 mL/min. (B) Offline Cumulant Z-av size and PDI of liposomes at varying concentrations using a vial module. Data are represented as mean±Std (N = 10). Dashed lines show the lower detection limit of the NFS-Thalia and NFS-Fides systems. (C) NFS-Thalia operational size-concentration range (marked blue) for size characterization of the present liposome system, as calculated by Rayleigh theory assuming that the refractive index and thickness of the liposome shell remain constant. The estimated detection limit of the NFS-Fides is also indicated. Image Credit: InProcess-LSP
To assess the detection limit of the NFS-Thalia and Fides systems, the liposomes were diluted in water, resulting in final lipid concentrations ranging from 0.01 to 2.84 mg/mL. Fig. 2B illustrates that the NFS-Thalia system is able to accurately measure the liposome size and PDI down to a very low lipid concentration of 0.02 mg/mL. Recirculation runs of the diluted suspensions at the relevant flow rates confirmed the applicability of this detection limit also for the inline measurement. The improved sensitivity of the NFS-Thalia system was further assessed by comparison to the measurement of the liposomes using the ‘standard’ NFS-Fides system. As shown by the second vertical line in Fig. 2B, accurate sizing of these liposomes using the NFS-Fides was only possible from a lipid concentration of ~1.5 mg/mL, indicating at least a ~75-fold improvement of the sensitivity of the NFS-Thalia. The newly developed system thus enables inline liposome characterization for an extremely broad range of lipid concentrations in manufacturing.
For the present liposome system, the detection limit observed in Fig. 2B for a specific size of 72 nm, can be generalized to the detection limit for liposomes of a general size by assuming Rayleigh scattering characteristics and a refractive index and thickness of the liposome shell independent of the liposome size8. This results in a minimum concentration cmin ∝ 1/d2. This size-dependent minimum concentration (or a concentration-dependent minimum size dmin ∝ 1/√c) is shown in the operational range diagram in Fig 2C. The lines represent the minimum size accessible at each lipid concentration, both for the new Thalia system (orange) and for the standard Fides system (dashed), while the blue area marks the range accessible to the NFS-Thalia9. This further highlights the extended low turbidity capabilities of the new SR-DLS system. The diagram is indicative only; for different liposome systems somewhat different limits may apply; particularly when liposomes encapsulate ingredients contributing to the scattering, even lower size/concentration limits may apply.
Monitoring Protein Formulations
In the second application, Bovine Serum Albumin (BSA) was dissolved in 10 mM Phosphate Buffered Saline (PBS) with physiological pH (~7.4) and ionic strength (~150 mM) with concentrations ranging from 10 to 200 mg/mL. The NFS-Thalia system was utilized to measure the hydrodynamic size of the proteins, aiming to investigate the impact of flow rate on protein size. To accomplish this, BSA in PBS was made to flow through a 0.25-inch flow cell at two different flow rates: 4 and 25 mL/min, using a syringe pump. The static measurement was used as the control for comparison.
As shown in Fig. 3A and B, ten successive rapid inline measurements revealed consistent hydrodynamic diameters of BSA (represented as the Z-av size of the main peak in the size distribution10): 7±1 nm with a PDI of 0.02±0.01 for 10 mg/mL BSA, and 6±1 nm with a PDI of 0.03±0.01 for 50 mg/mL BSA. The results depicted in Fig. 3C and D reveal that the measured hydrodynamic diameters remained consistent between the flow and static measurements, with PDIs below 0.15. While the flow rates in these experiments are still moderate (max 1.5 L/hr), they may be increased by a factor of 10-100 (by using NFS flow cells of different sizes) without impacting the inline measurement capabilities of the system. Measurements at such high flow rates are a unique feature of the SR-DLS method and show the success of the advanced flow correction algorithms in the NFS XsperGo software.
As a final illustration of the measurement capabilities, Fig. 3C and D show measurements of the apparent hydrodynamic diameter (again shown as main peak Z-av size) and PDI with increasing BSA concentrations. It is known that the concentration dependence of the apparent DLS size provides information about the protein interaction constant KD, where an increase in size with concentration indicates attractive ‘sticky’ interactions, while repulsive (or ‘hard sphere’ type) interactions cause a decrease in apparent size with concentration (due to collective diffusion effects11,12). The data in Fig. 3C clearly show the latter behavior in the present BSA suspensions, i.e. a repulsive interaction between the albumin proteins, which indicates the stability of the formulation and the absence of significant aggregation mechanisms. Worth noting here is that with the novel NFS-Thalia system, the protein interaction parameter may now also be characterized inline, using flow rates relevant to a broad range of biopharmaceutical processes, and using inline (flow cell) configurations that are easy to integrate these processes. The observed trend of the decrease in apparent size with concentration aligns well with findings reported in previous publications11,12 on the stability and interactions of BSA under the present conditions. The drastically improved sensitivity of the Thalia system also enhances the capabilities of SR-DLS to monitor the formation of protein aggregates inline, enabling studies of e.g. flow- or temperature-induced protein aggregation, which is strongly relevant for the therapeutic efficacy and safety of biopharmaceutical formulations.
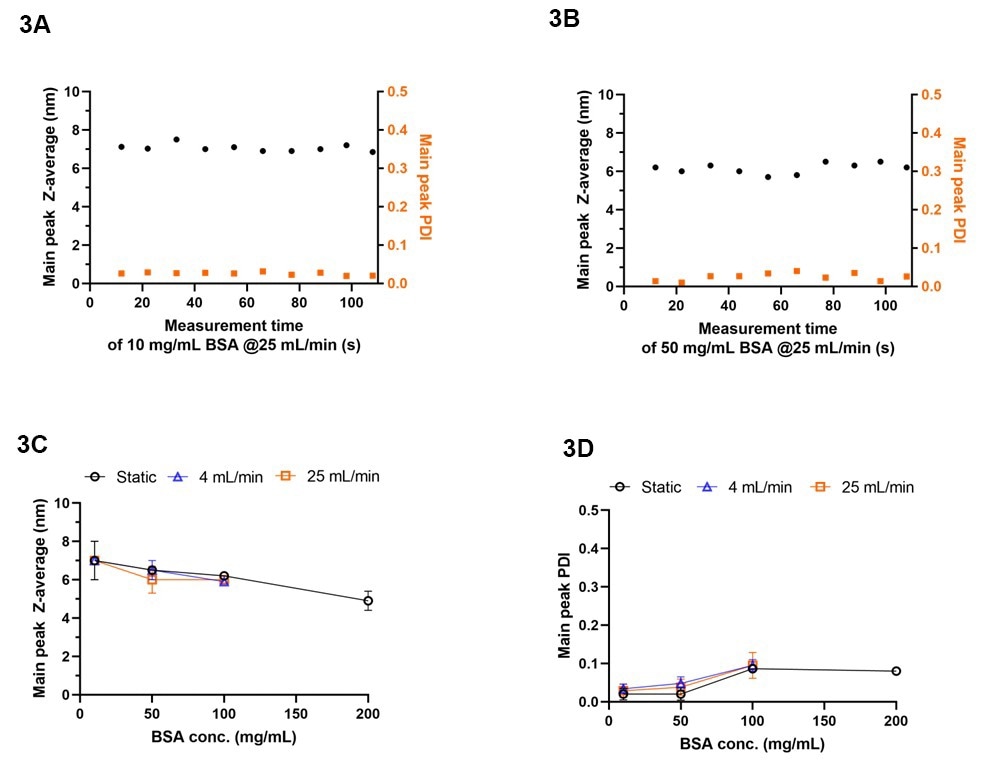
Figure 3. Size characteristics of BSA using NFS-Thalia as measured offline and inline. (A-B) Inline main peak Z-av size and PDI of 10 and 50 mg/mL BSA in PBS over 10 consecutive measurements at a flow rate of 25 mL/min using the 0.25-inch flow cell module. (C-D) Inline main peak Z-av size and PDI of BSA in PBS at concentrations of 10, 50, 100, and 200 mg/mL, at flow rates of 4, and 25 mL/min using the 0.25-inch flow cell module, as compared to static measurements. Data are represented as mean±Std (N = 10). Image Credit: InProcess-LSP
Conclusion
This application note focuses on the use of SR-DLS technology for the continuous size monitoring of liposome manufacturing at low concentrations and sub-10 nm protein measurement using the newly developed high-sensitivity NFS-Thalia system. By leveraging the unique SR-DLS technique and advanced data processing capabilities, and extending the sensitivity of SR-DLS by a factor of at least 75, the NFS-Thalia enables inline monitoring of lipid-based nanoparticles and proteins, at very low turbidity levels that were previously inaccessible for SR-DLS inline measurements. Integrating the NFS-Thalia into a continuous manufacturing/bioprocessing system brings numerous advantages, including enhanced process understanding, improved quality control, higher efficiency, and reduced costs. It can thus play an important role in the general improvement of the biotherapeutics process and formulation development and manufacturing.
Acknowledgment
We would like to thank our partner Dr. Antonio Costa from DIANT Pharma Inc. for the technical support in using the LARU system.
References
- M. Danaei, M. Dehghankhold, S. Ataei, F. Hasanzadeh Davarani, R. Javanmard, A. Dokhani, S. Khorasani, M.R. Mozafari, Impact of particle size and polydispersity index on the clinical applications of lipidic nanocarrier systems, Pharmaceutics. 10 (2018) 1–17.
- M.L.E. Lundahl, S. Fogli, P.E. Colavita, E.M. Scanlan, Aggregation of protein therapeutics enhances their immunogenicity: Causes and mitigation strategies, RSC Chem Biol. 2 (2021) 1004–1020.
- S. Shah, V. Dhawan, R. Holm, M.S. Nagarsenker, Y. Perrie, Liposomes: Advancements and innovation in the manufacturing process, Adv Drug Deliv Rev. 154–155 (2020) 102–122.
- L.X. Yu, G. Amidon, M.A. Khan, S.W. Hoag, J. Polli, G.K. Raju, J. Woodcock, Understanding pharmaceutical quality by design, AAPS Journal. 16 (2014) 771–783.
- R. Besseling, R. Arribas-Bueno, R. Van Tuijn, A. Gerich, Real-time droplet size monitoring of nano-emulsions during high pressure homogenization, (2022). https://www.inprocess-lsp.com/download-nanoemulsion-whitepaper.
- C.C.L. Schuurmans, J.-P. Wijgergangs, A. Gerich, R. Besseling, Continuous size monitoring of turbid titanium dioxide nanosuspensions with the nanoflowsizer, 2022. https://www.azonano.com/article.aspx?ArticleID=5803.
- R. Besseling, M. Damen, J. Wijgergangs, M. Hermes, G. Wynia, A. Gerich, New unique PAT method and instrument for real-time inline size characterization of concentrated, flowing nanosuspensions, European Journal of Pharmaceutical Sciences. 133 (2019) 205–213.
- In the Rayleigh(-Gans-Debeye) regime, scattered intensity is I ∝ C ⋅ d2 with c the lipid concentration and d the liposome size. The minimum concentration needed for SR-DLS is set by a minimum scattering signal, Imin = cmin ⋅ d2, giving the form for the detection limit in the main text.
- In the upper/ upper right range of the diagram, the volume fraction of liposomes (not the lipids) may reach a level > ~10%. In this regime, liposome interactions may alter their free diffusion and thus the ‘apparent’ size obtained from the standard Stokes-Einstein form.
- Due to the residual effects of contaminations or the presence of residual protein aggregates, the Z-av size of the main peak in the measured particle size distribution provides a more reliable representation of the hydrodynamic diameter of the primary protein compared to the Cumulant Z-av.
- P.S. Sarangapani, S.D. Hudson, R.L. Jones, J.F. Douglas, J.A. Pathak, Critical examination of the colloidal particle model of globular proteins, Biophys J. 108 (2015) 724–737.
- P.S. Sarangapani, S.D. Hudson, K.B. Migler, J.A. Pathak, The limitations of an exclusively colloidal view of protein solution hydrodynamics and rheology, Biophys J. 105 (2013) 2418–2426.

This information has been sourced, reviewed and adapted from materials provided by InProcess-LSP.
For more information on this source, please visit InProcess-LSP.