Quantum dots (QDs) are semiconducting nanoparticles with distinct optical and electrical properties that fall between bulk materials and discrete molecules.
- QDs' size-dependent tunability makes them suitable for several applications, including photovoltaics, biomedical imaging, and display technology.
- The DB30 UV-Vis Spectrophotometer accurately measures QD diameters in accordance with ISO/TS 17466.
These distinguishing characteristics are attributable in part to QDs' unusually high surface-to-volume ratio, which means that a considerable proportion of their atoms are placed on the surface of the crystalline lattice.
In addition, the radii of QDs typically range from 2 to 10 nm, resulting in strong quantum confinement effects.
These effects split the electronic bands in QDs into separate energy levels, altering the material's properties.
As the size of a QD decreases, the band gap widens (Figure 1), causing a shift in the wavelength of emitted light, electrical conductivity, and optical characteristics of the QD.
QDs' size-dependent tunability makes them valuable in a variety of applications, including photovoltaics, biomedical imaging, and display technologies.
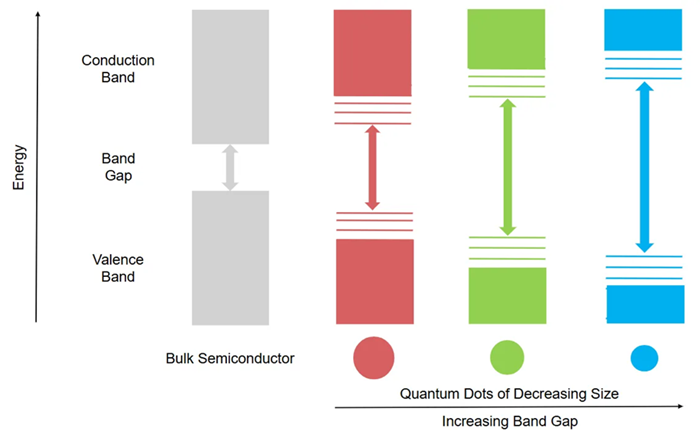
Figure 1. Band structure of a bulk semiconductor vs. QDs, and effects of QD size on band gap. Arrows represent the transition corresponding to the first excitonic absorption. Image Credit: Edinburgh Instruments
In this article, the Edinburgh Analytical DB30 UV-Vis Spectrophotometer (Figure 2) is used to characterize CdSe/ZnS QD samples in solution.
ISO/TS 17466 (Use of UV/Vis absorption spectroscopy in the evaluation of cadmium chalcogenide colloidal quantum dots, 2015) defines a direct relationship between the first excitonic absorption peak and particle size for determining the diameter of QDs.1
The DB30's touchscreen interface, high-scanning rate, and double-beam technique provide simple, speedy QD analysis.
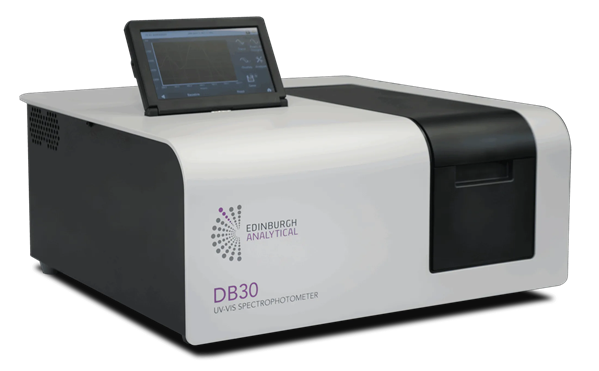
Figure 2. Edinburgh Analytical DB30 UV-Vis Spectrophotometer. Image Credit: Edinburgh Instruments
Sample Preparation
CdSe/ZnS QDs were dissolved in toluene (Sigma Aldrich) to the desired concentration (absorbance < 1 at the first excitonic absorption peak) and inserted into 10 mm pathlength quartz cuvettes. Toluene was used as a reference.
Instrument Configuration
UV-Vis spectroscopic measurements were taken with an Edinburgh Analytical DB30 UV-Vis Spectrophotometer, and settings were selected using the touchscreen interface (Figure 3). A narrow wavelength range was used to better locate the first excitonic absorption peak.
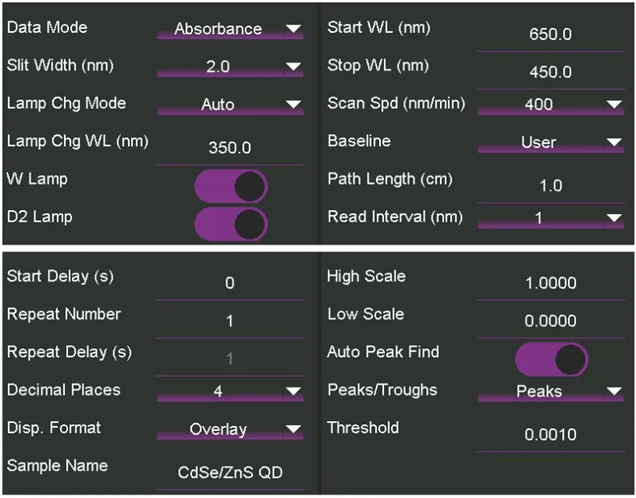
Figure 3. Experimental parameters on the DB30 UV-Vis Spectrophotometer touchscreen interface. Image Credit: Edinburgh Instruments
Procedure
- A baseline measurement was conducted with an empty sample chamber.
- A cuvette with the QD solution was inserted into the sample beam location, and the toluene reference cuvette was added to the reference beam position.
- A scan was performed using the specified settings (Figure 3).
- The initial excitonic absorption peak was found by determining the longest wavelength local maximum in the absorption spectra.
- The diameter of the QDs in the sample was calculated using an empirical size calculation from ISO/TS 17466 based on their wavelength.1
Diameter of CdSe QDs from UV-Vis Absorption Spectra
The first excitonic absorption peak corresponds to the lowest-energy optical transition between the QD's discrete electronic states (Figure 1).
DB30's Peaks and Troughs analysis revealed a peak for the produced CdSe/ZnS solutions at λ = 526.0 nm (Figure 4). It was explained by the excitonic transition from the ground state in the valence band to the first excitonic excited state in the conduction band.
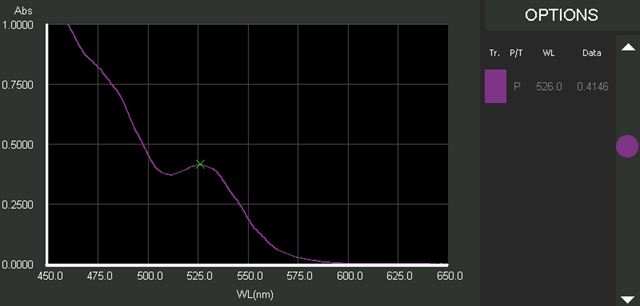
Figure 4. UV-Vis absorption spectrum of CdSe QDs taken from the DB30 touchscreen interface. The Peaks and Troughs function determined the first excitonic absorption peak at 526.0 nm. Image Credit: Edinburgh Instruments
The link between a QD's diameter (D) and its initial excitonic absorption peak is empirically measured using transmission electron microscopy (TEM) measurements, or X-ray diffraction (XRD) in the case of very small CdSe nanoclusters 2
In this case, the empirical sizing equation was derived from ISO/TS 17466, while some scholarly articles specify different coefficients based on likely TEM measurement errors.1,3
The relationship formula for ISO/TS 17466 is as follows:
D (nm) = 41.57 – 0.4277λ + 1.6242 x 10⁻³λ2 – 2.6575 x 10⁻⁶λ3 + 1.6122 x 10⁻⁹λ4
The produced solution contained CdSe/ZnS QDs with a diameter of D = 2.64 nm. This demonstrated that UV-Vis absorption spectroscopy on the DB30 UV-Vis Spectrophotometer is a quick way to estimate QD diameter.
Conclusion
This article explained how to use the Edinburgh Analytical DB30 UV-Vis Spectrophotometer in a spectroscopic approach to determine the diameter of CdSe/ZnS QDs.
Given the growing range of biomedical and technological applications for QDs, a straightforward approach to estimating their size is becoming increasingly vital. The DB30's user-friendly touchscreen interface and fast scan speed enable quick and easy QD analysis and characterization.
References
- ISO (2015). ISO/TS 17466: Use of UV-Vis absorption spectroscopy in the characterization of cadmium chalcogenide colloidal quantum dots. Available at: https://www.iso.org/standard/59853.html.
- Yu, W.W., Qu, L., Guo, W. and Peng, X. (2003). Experimental Determination of the Extinction Coefficient of CdTe, CdSe, and CdS Nanocrystals. Chemistry of Materials, 15(14), pp.2854–2860. DOI: 10.1021/cm034081k. https://pubs.acs.org/doi/10.1021/cm034081k.
- Jasieniak, J., et al. (2009). Re-examination of the Size-Dependent Absorption Properties of CdSe Quantum Dots. The Journal of Physical Chemistry C, 113(45), pp.19468–19474. DOI: 10.1021/jp906827m. https://pubs.acs.org/doi/10.1021/jp906827m.

This information has been sourced, reviewed, and adapted from materials provided by Edinburgh Instruments.
For more information on this source, please visit Edinburgh Instruments.