The BeNano 180 Zeta Max nanoparticle analyzer from Bettersize Instruments is a state-of-the-art instrument designed to combine both light scattering and transmission techniques.
The BeNano 180 Zeta Max provides precise measurements of a range of particle characteristics within a single compact system, including size and concentration, molecular weight, zeta potential, refractive index, and rheological properties.
A range of measurement modes is available, each offering distinct advantages.
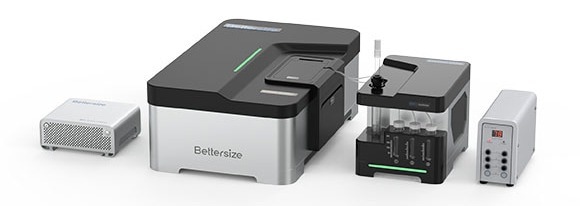
Image Credit: Bettersize Instruments Ltd.
Measurement Modes
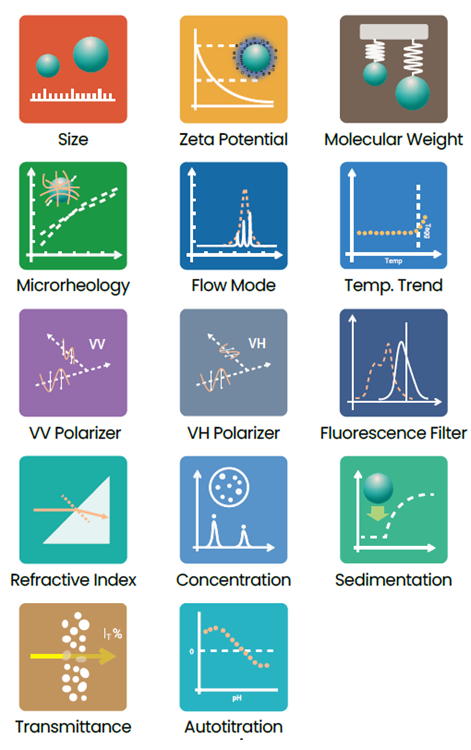
Image Credit: Bettersize Instruments Ltd.
Backscattering Dynamic Light Scattering
Backscattering dynamic light scattering collects more scattered light than 90° optics, increasing its sensitivity to small particles. The instrument’s advanced auto-adjusting measurement position ensures accurate size results, even when working with concentrations of up to 40% w/v.
Phase Analysis Light Scattering
Phase analysis light scattering can precisely distinguish weak to strong electrophoretic signals and allows the collection of superior zeta potential measurements, particularly in high-salinity conditions or near isoelectric points.
Autotitrator and Degasser
The BAT-1 auto titrator can automate pH titration from one to 13. It can also be integrated with a triple-channel degasser, where necessary, to eliminate air bubbles during titration.
Novel 0° Detector Module
Positioned at 0°, this module uses a powerful photodiode and a CMOS camera to measure concentration, refractive index, and microparticle size via sedimentation.
Ultra-Low Sample Volume
The BeNano 180 Zeta Max is ideally suited for early-stage research. Its capillary sizing cell facilitates precise size measurements using only 3-5 μL of sample.
Adjustable Correlator Mode
The BeNano 180 Zeta Max has fully configurable short, medium, and long-time correlator modes, which can be adjusted based on sample type. This enables adaptable and powerful correlation function calculation.
Works in Combination with GPC/SEC or FFF
The instrument’s flow mode enables high-resolution size analysis. Accurate volume-weighted results are ensured as the BFC-1 signal collector auto-triggers and captures RI or UV signals from FFF or GPC/SEC.
Regulatory Compliance
The BeNano 180 Zeta Max fully complies with ISO 22412 and ISO 13099. IQ/OQ tools and FDA 21 CFR Part 11 support ensure the instrument is suitable for regulated environments.
Source: Bettersize Instruments Ltd.
| Features |
BeNano 180 Zeta Max |
| Particle Size - 90° DLS |
√ |
| Particle Size - 173° DLS |
√ |
| Zeta Potential |
√ |
| Molecular Weight |
√ |
| Microrheology |
√ |
| Refractive Index |
√ |
| Concentration |
√ |
| Sedimentation |
√ |
| Transmittance |
√ |
| Temperature Trend |
√ |
| VV & VH & Fluorescence Filter |
√ (Opt.) |
| Flow Mode |
√ (Opt.) |
| Autotitration |
√ (Opt.) |
Size Measurement
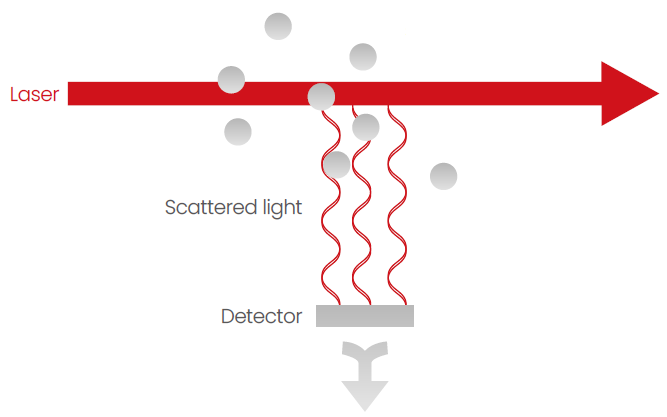
Dynamic Light Scattering (DLS), also referred to as Quasi-Elastic Light Scattering (QELS) or Photon Correlation Spectroscopy (PCS) can be used to determine particle size by analyzing Brownian particle motion in a dispersion.
The principle of Brownian motion relates particle size to velocity. Particles diffuse at different rates depending on their size: smaller particles diffuse more rapidly, and larger particles diffuse more slowly.
The particles’ scattering intensities are detected using an avalanche photodiode (APD) before being converted into a correlation function. A mathematical algorithm is derived from this correlation function and then applied to obtain the diffusion coefficient (D).
It is also possible to calculate the hydrodynamic diameter (DH) and its distribution using the Stokes-Einstein equation, which relates the diffusion coefficient to the particle size.
D = KBT/3πηDH
Most light passes through the sample without being scattered. Image Credit: Bettersize Instruments Ltd.
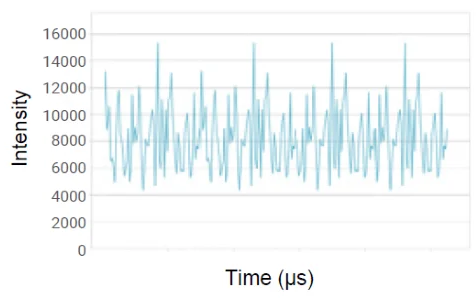
Intensity Fluctuations of Small Particles. Image Credit: Bettersize Instruments Ltd.
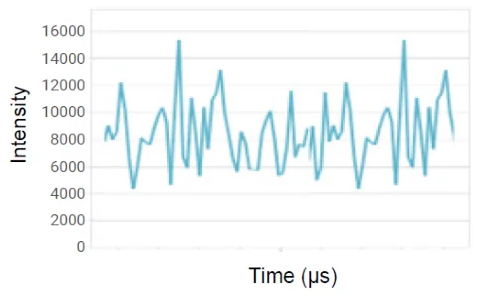
Intensity Fluctuations of Large Particles. Image Credit: Bettersize Instruments Ltd
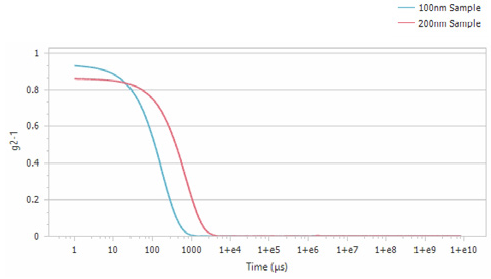
In correlation functions, a 200 nm sample decays slower than a 100 nm sample due to slower intensity fluctuation. Image Credit: Bettersize Instruments Ltd.
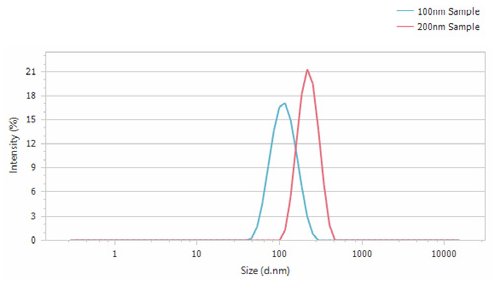
From the above correlation functions, the size and size distribution can be determined using the Stokes-Einstein equation. Image Credit: Bettersize Instruments Ltd.
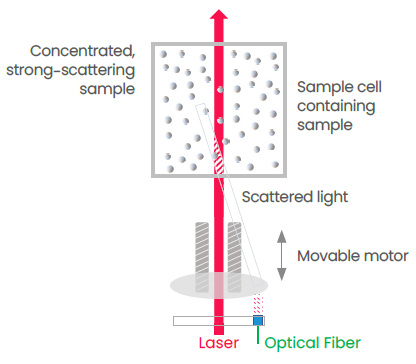
Backscattering Dynamic Light Scattering
The analyzer uses backscattering optics to automatically determine the best detection position, evaluating the sample’s concentration, size, and scattering characteristics.
This ensures maximum measurement accuracy and allows the instrument’s users the adaptability necessary to evaluate a diverse array of samples with a wide range of properties.
Features and Benefits
Wider Concentration Range
Optimizing the detection position allows for the detection of highly concentrated samples close to the edge of the sample cell, minimizing errors from multiple light scattering.
Increased Sensitivity
The BeNano 180 Zeta Max’s configuration offers approximately ten times greater sensitivity and eight to ten times the scattering volume of traditional 90° optics.
Expanded Size Detection Range
Minimizing multiple light scattering from larger particles enhances measurement accuracy. The BeNano 180 Zeta Max’s significantly larger scattering volume further reduces the number of fluctuations of large particles, improving reliability.
Better Reproducibility
Reproducibility is improved by the BeNano 180 Zeta Max’s capacity to reduce the impact of dust contaminants and unevenly distributed agglomerates.
Intelligent Search for the Optimal Detection Position
The detection point in the middle of the sample cell. Image Credit: Bettersize Instruments Ltd.
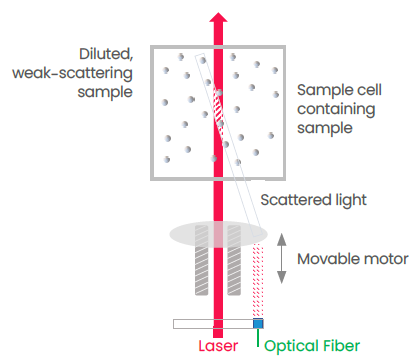
Placing the BeNano 180 Zeta Max’s detection point in the center of the sample cell increases instrument sensitivity due to the resulting large scattering volume. This approach is well-suited for detecting dilute samples with weaker scattering effects.
The detection point at the edge of the sample cell. Image Credit: Bettersize Instruments Ltd.
Placing its detection point at the edge of the sample cell helps to avoid the multiple scattering effect of high-concentration samples. This ensures more accurate and repeatable particle size results.
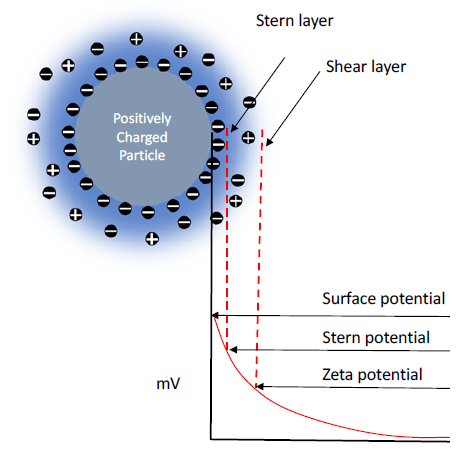
Zeta Potential Measurement
In aqueous systems, charged particles are surrounded by counter-ions that form an outer shear layer and an inner Stern layer. The electrical potential at the interface of the sheer and Stern layer is the zeta potential. A higher zeta potential indicates the suspension system has higher stability and less aggregation.
Electrophoretic light scattering (ELS) can measure electrophoretic mobility via Doppler shifts of scattered light. Henry's equation can then be used to determine a sample's zeta potential.
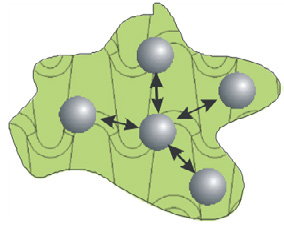
A stable particle system will exhibit a high repulsion force of particles and, therefore, a high zeta potential. An unstable particle system will be subject to flocculation, aggregation, and sedimentation and, therefore, exhibit a low or even zero zeta potential.

Stable particle system. Image Credit: Bettersize Instruments Ltd.

Unstable particle system. Image Credit: Bettersize Instruments Ltd.
Phase Analysis Light Scattering (PALS)
Bettersize has developed Phase Analysis Light Scattering (PALS) to measure the zeta potential. PALS is a more advanced technique than traditional ELS and offers a range of advantages.
Features and Benefits
- PALS enables accurate measurements of samples exhibiting low electrophoretic mobility and samples exhibiting high conductivity.
- Suitable for analyzing samples in organic solvents with low dielectric constants.
- It can also effectively measure the zeta potential of particles whose charge approaches the isoelectric point.
Potential Distribution at Particle Surface. Image Credit: Bettersize Instruments Ltd.
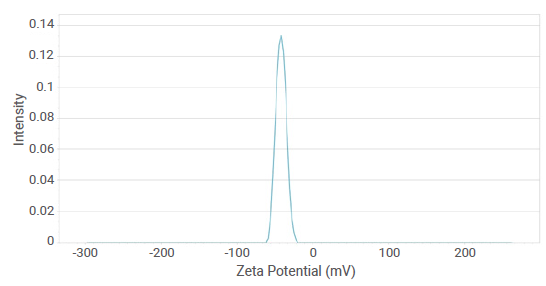
Zeta Potential Distribution. Image Credit: Bettersize Instruments Ltd.
Electrostatic Forces Between Particles. Image Credit: Bettersize Instruments Ltd.
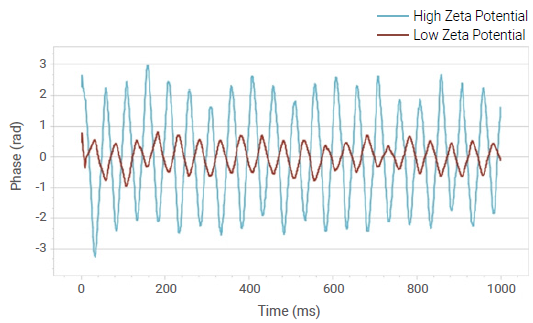
Phase Plot of PALS. Image Credit: Bettersize Instruments Ltd.
Molecular Weight Measurement
Static light scattering (SLS) is a technique used to measure scattering intensities. Using the Rayleigh equation it enables the calculations of a sample’s weight-average molecular weight (Mw) and second virial coefficient (A2) .
In the formula above:
- c is the sample concentration
- θ is the detection angle
- Rθ is the Rayleigh ratio used to characterize the intensity ratio between the scattered light and the incident light at the angle of θ
- Mw is the sample’s weight-average molecular weight
- A2 is the second virial coefficient
- K is a constant related Kc to (dn/dc)2
Image Credit: Bettersize Instruments Ltd.
Features and Benefits
- SLS is a non-invasive technique
- It is ideally suited for use with particles dissolved in liquid
- SLS can measure the molecular weight of samples smaller than 30 nm
- It provides a second virial coefficient (A2), which indicates the intermolecular interactions
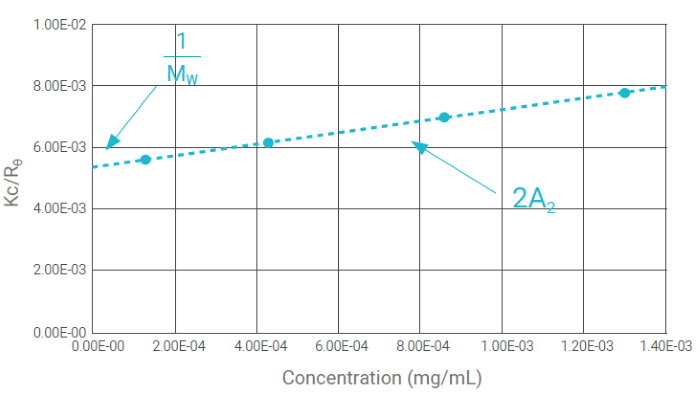
Debye Plot. Image Credit: Bettersize Instruments Ltd.
 Click here to learn more