Sponsored by HORIBAAug 17 2005
Single-walled carbon nanotubes (SWCNs) and quantum dots have received much attention recently. These nanomaterials fluoresce in the visible and IR regions; this fluorescence can be used to characterize their properties and structure. The NanoLog™, a modular spectrofluorometer from Horiba specifically designed for researching nanomaterials, is shown to be able to rapidly (seconds to minutes) collect and analyze the instrument-corrected fluorescence spectra of nanomaterials for characterization.
Both SWCNs in aqueous sodium dodecyl sulfate, and quantum dots have been studied using the NanoLog™, which includes InGaAs near-IR detectors, CCD arrays, or IR-sensitive photomultiplier tubes, and software for spectral analysis.
Single-Walled Carbon Nanotubes (SWCNTs) and Quantum Dots – Properties, Fluorescence and Applications
Single-walled carbon nanotubes (SWCNs) and quantum dots, as well as related nanomaterials, are under intense study because of their novel properties and potential uses in the fields of materials science, biotechnology, and medicine. Fluorescence of SWCNTs and quantum dots varies according to their size and shape. Such fluorescence in the IR can be used to characterize the properties and structure of these nanomaterials. Rapid spectral acquisition and analysis of nanomaterials is useful in the fields of chemistry, biology, and materials science; therefore Horiba has designed a spectrofluorometer, the NanoLog™ (see figure 1), specifically for such uses.
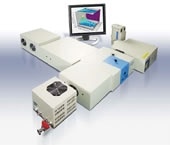
Figure 1. NanoLog™ spectrofluorometer from Horiba Scientific, specifically designed to detect fluorescence from nanomaterials.
Sonicating Single-Walled Carbon Nanotubes (SWCNTs) in Sodium Dodecyl Sulfate - a Description of the Experimental Process
An uncharacterized mixture of SWCNs was sonicated for 30 min in a sodium dodecyl sulfate solution in D2O at room temperature. The sample was placed in a cuvette (path length = 5 mm) in a NanoLog™ spectrofluorometer set up with emission detection at right-angles to the excitation. Excitation of the sample was performed with a 450 W Xe CW lamp shining into a double-grating excitation monochromator (Spex® 180DF, 1200 grooves/mm blazed at 330 nm). Excitation band-pass was set to 14.7 nm, and the excitation was scanned from 550 nm to 800 nm in 5 nm steps. The emission spectrometer was a single-grating TRIAX 320 (150 grooves/mm blazed at 1200 nm). Bandpass was set to 12.5 nm. The emission spectrum was captured using a liquid-nitrogen-cooled Symphony® CCD InGaAs array (512 × 1 pixel; see Figure 2) from 836.044 nm to 1359.93 nm, with 20s integration per scan, and 50 scans recorded. A silicon photodiode was used as a reference detector.
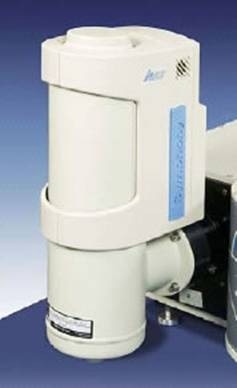
Figure 2. Symphony® CCD array attached to the TRIAX 320 spectrometer on the NanoLog™.
Software Tools Used to Analyze the Data from the Excitation/Emission Matrix-Scan
After an excitation/emission matrix-scan is recorded, the data may be analyzed with Horiba's Nanosizer™ software (patent pending), to assign spectral peaks to particular SWCN structures. A sample screenshot of the Nanosizer™ software is presented in figure 3. An overview of the Nanosizer™ algorithm is given in the paragraph immediately below figure 3.
Figure 3. Screenshot of Nanosizer™ software used to assign spectral peaks to SWCN structures.
How the Nanosizer Software Program Works
The software selects a region of interest within the matrix scan, and calculates first- and second-derivatives of all excitation and emission channels. It then finds peaks in those derivative surfaces, and generates a table of hypothetical values for spectral bands, including amplitude of peak, center of excitation and emission bands and their concomitant standard deviations. These hypothetical coordinates are tested against a known spectral library; positive matches are used to generate an improved hypothetical table, while negative matches are used unchanged within the improved hypothetical table. A double-convolution model is used to define each spectral component, via lineshape functions of excitation peak, standard deviation, and amplitude, with the emission peak, standard deviation, amplitude. The model and data are used to compute a goodness-of-fit parameter (reduced X2 or sum of squared residual errors). If the residual-error sum is acceptable, the parameters are used for a final assignment. If the residual-error sum is unacceptable, then peaks may be added or deleted for re-parameterization.
The Results that Emerged from this Experiment
Corrected spectra (signal/reference) of the SWCN mixture are presented as an excitation-emission matrix in figure 4. To show the operation of the Nanosizer™ peak-characterization software, a simulation of corrected (signal/reference) data was created based on known assignments and analyzed. In figures 5 and 6, plot (figure 5) shows the assignment of spectral peaks to various SWCN structures with (figure 6) a table of results. Included in the table of results is the assigned radial breathing mode ωRBM of each species, which can be used to calibrate the instrument, or compare to an independent Raman measurement.
Figure 4. Corrected spectra (signal/reference) plotted as a function of excitation and emission wavelength from SWCNs.
Figure 5. Assignment of spectral peaks by the Nanosizer™ software. Chirality is given as (n,m).
Figure 6. Table generated by the Nanosizer™ software, based on analyzing the excitation-emission matrix. Columns from left to right are: SWCN peak number, peak intensity, excitation λ (nm), peak emission λ (nm), chirality (n,m), radial breathing mode ωRBM (cm–1), and nanotube diameter dt (nm).
Conclusions and List of Tools Used in this Experiment
The NanoLog™ uses state-of-the-art multi-channel near-IR wavelength-detection for rapid and robust acquisition of photoluminescence excitation-emission matrices. These matrices play a central role in the analysis of the diameter and chirality of semiconductive species of SWCN mixtures. The Nanosizer™ software package incorporates a novel “double-convolution integral” method (patent-pending) for fast and accurate analytical simulation of photoluminescence excitation-emission matrices. The Nanosizer™ algorithm is signified by its capacity to reduce the number of model parameters by up to three orders of magnitude compared to conventional two-dimensional (intensity vs. wavelength) multi-peak simulators. The Nanosizer™ generates the complete excitation-emission matrix, yielding analytical solutions for the chirality, diameter, and (n,m) values for all detected SWCNs in a given sample.

This information has been sourced, reviewed and adapted from materials provided by HORIBA.
For more information on this source, please visit HORIBA.