DOI :
10.2240/azojono0107
Dec 5 2005
Single catalytic events of the enzyme chitosanase have been observed by measuring height fluctuations of proteins using an atomic force microscope (AFM) operated in fluid tapping mode. A protein-tracking technique was used, where the AFM tip was periodically repositioned on top of a single protein molecule in order to compensate for thermal drift. Height fluctuation data was taken during time slices of 0.2 seconds with the tip on top of the protein molecule and compared to data taken on the mica support.
Adding the enzyme’s substrate to the buffer solution enabled us to observe protein motion, due to conformational changes, during catalytic activity. Single catalytic events have been measured with high spatial and temporal resolution. Height fluctuations of the protein due to conformational changes during activity, have a value of 0.4 nm and last for 2-8 ms. From the rate of these events (about 120 per second) we estimated an enzymatic activity of 170-260 U/mg which is in very good agreement with the activity of the enzyme as determined in conventional assays.
These specific height fluctuations could not be observed on inactive enzymes. Furthermore different bivalent metal ions were tested for their inhibitory properties. Cu2+ acted as an inhibitor and suppressed the activity entirely, whereas Mn2+ and Zn2+ reduced the rate and size of height fluctuation by about a factor of 2.
Background
Atomic Force Microscopy and Proteins
Atomic force microscopy (AFM)[1, 2] is a high resolution microscopy technique with the possibility to be operated in liquids. This allows studying biological processes in physiological environments. It has been applied to various biological systems, ranging from whole cells to molecular structures like proteins and nucleic acids[3-6]. Several groups have imaged stable membrane proteins at molecular resolution[7-9] but also single globular proteins[10, 11]. The development of tapping mode in fluid[12-14] introduced a new and very sensitive imaging mode, which opens up the possibility to study proteins physisorbed to supports in a consistent and highly reproducible manner[15].
Although lateral resolution is limited by the size and shape of AFM tips, vertical resolution can be in the sub-nanometer range. Thus the height signal can be used to measure the motion of proteins adsorbed to surfaces[16]. As globular proteins have dimensions in the nanometer range, thermal drift in the microscope will usually limit measurement times to a few seconds or even less. Here, we have employed the protein-tracking technique[17], where the AFM tip is periodically repositioned onto a single protein molecule in order to compensate for drift. This technique enables us to measure height fluctuations of single molecules for extended times, only limited by the stability of the protein itself.
Chitosanase
Enzymes are the most widespread and specialized proteins exhibiting catalytic activity. Almost all chemical reactions of organic biomolecules in living cells are catalyzed by enzymes. During the catalytic process most of them undergo a conformational change. Here we report on AFM measurements of these conformational changes of the enzyme chitosanase from Streptomyces griseus. This enzyme is able to decompose chitosan, a polysaccharide similar to cellulose, the most widespread polysaccharide. It consists of partially or completely deacetylated chitin (poly-β-1,4-D-N-acetylglucosamine) and is found naturally in cell walls of some fungal species[18]. For our studies we used completely deacetylated chitosan pentamers as a substrate for chitosanase.
Chitosanases from more than 30 organisms have been isolated[19]. The chitosanase from Streptomyces griseus on which we report here, has a molecular weight of about 35kD as determined by poly-acrylamide gel electrophoreses[20]. Known inhibitors are Hg2+, Cu2+, Fe2+, and Ag2+ ions[19]. There is some ambiguity on the pH optimum for catalytic activity. Values in the range of 5-6.5[21] as well as 8.0[20] have been reported. The enzymatic activity as given by the vendor is 208 U/mg. One unit (U) will liberate 1.0 µmole of reducing sugar from chitosan per minute at pH 5.0 at 37°C. With the molecular weight of 35kD we calculated a turnover number of the enzyme of 120 per second. The magnitude of any conformational changes during activity of this chitosanase is not known yet. However, for another related chitosanase from Streptomyces sp. N174[22], a value of 0.28-0.38 nm or even more is known (personal communication with R. Brzezinski, Université de Sherbrooke, Canada).
AFM of Absorbed Enzymes
Since AFM is a surface sensitive technique, adsorption of molecules to the support is a crucial point for AFM imaging and measurements. The isoelectric point of the chitosanase used in this study is pH 9.7[20]. Therefore the enzyme will be highly positively charged at pH 5.5, which we used for all our measurements. Consequently we tried to adsorb the molecules by electrostatic forces to a negatively charged support. We chose mica, because it can easily be cleaved and exhibits an atomically flat and clean surface carrying negative charges on its surface in aqueous solution. We have checked the activity of the adsorbed enzyme by a qualitative activity assay based on a modification of Schales’ method[23, 24].
Height fluctuations of protein molecules were recorded with and without substrate in the buffer solution, i.e. on active and inactive enzymes, and compared to data taken on the support. Furthermore we investigated the influence of metal ions (5mM of Cu2, Mn2+, or Zn2+) on these fluctuations.
Materials and Methods
Instrumentation
The AFM was a commercial instrument (Nanoscope IIIa; Digital Instruments, Santa Barbara, CA) operated in tapping mode. The cantilevers used for all measurements were boron doped Ultralevers (Park Scientific, Sunnyvale, CA) with spring constants of 0.26 N/m and 0.40 N/m, respectively. Oscillation frequencies in liquid were about 9 kHz. The piezo-tube scanner had a maximum scan range of about 10 µm (D-scanner; Digital Instruments).
Protein-tracking measurements were performed with a home-built system. The device was designed to position the AFM tip periodically onto a single protein molecule in order to compensate thermal drift. The set-up consisted of a PC interfaced to the AFM controller. The PC was used to position the AFM tip by applying external signals in addition to those generated by the AFM controller and to monitor the height signals from the piezo. Protein-tracking was performed as follows. The commercial AFM was used to zoom in on a single molecule of interest in the center of the scan area. Then scanning was stopped by setting the scan size to zero.
At this point the tracking PC took over scanning, making three scan lines each in x- and y-direction in order to determine the highest point of the protein. Then the tip was positioned at this point and left in place for 0.2 seconds. During this time the height fluctuations, i.e. the piezo z-signal, were recorded. Afterwards, the cross-wise scanning over the molecule was recommenced and the cycle repeated. In this way, a series of height fluctuation data sets were recorded (typically 50-100) over a single molecule. In the same manner data were acquired also on the support after each measurement on a protein as a reference. This setup has been described in Thomson et al. However, here we have used different hardware (National Instruments data acquisition boards, PCI-MIO-16XE-10, National Instruments, München) and software (Labview, National Instruments, München) to establish protein tracking.
Absorbance measurements for the activity assay were performed with a Lambda 15 UV/VIS Spectrophotometer (Perkin Elmer Instruments Inc., Norwalk, CT).
Sample Preparation
Reagents
Acetate buffer: 100 mM sodium acetate, 50 mM sodium chloride, adjusted to pH 5.5. Protein solution: 4.8 µg chitosanase (Sigma-Aldrich, Deisenhofen, Germany) dissolved in 10 ml of acetate buffer. Soluble chitosan: 10 µMol chitosan pentamers (Seikagaku Corporation, Tokyo, Japan; 100% deacetylated) dissolved in 10 ml of acetate buffer. Buffer with bivalent metal ions: 5 mM of CuSO4, MnCl2 and ZnCl2, respectively, dissolved in above acetate buffer.
Procedure
50 µl chitosanase solution was incubated on a freshly cleaved mica disc (diameter ~15 mm) (Plano W. Plannet GmbH, Wetzlar, Germany) for 30 seconds, then extensively rinsed with acetate buffer to remove free and only weakly adsorbed proteins and subsequently inserted in the fluid cell of the AFM. The sample was never allowed to dry at any time during this preparation. AFM imaging and measurements were performed in pure acetate buffer or buffer with chitosan or metal ions. Solutions were replaced in situ while investigating the sample by AFM.
Chitosanase Activity Test
Principle
The qualitative assay is based on a modification of Schales' method, a simple color reagent test sensitive to reducing groups as they are produced in the hydrolysis of chitosan oligomers. Chitosan pentamers were used as a reference compound.
Reagents
Acetate buffer: 100 mM sodium acetate, 50 mM sodium chloride, adjusted to pH 5.5. Protein solution: 14.4 µg chitosanase (Sigma-Aldrich, Deisenhofen, Germany) dissolved in 10 ml of acetate buffer. Soluble chitosan: 10 µMol chitosan pentamers (Seikagaku Corporation, Tokyo, Japan; 100% deacetylated) dissolved in 10 ml of acetate buffer. Schales' reagent: 0.5 g of sodium ferricyanide in 1 liter of 0.5 M sodium carbonate, stored in a brown bottle.
Procedure
1.5 ml chitosanase solution was incubated on freshly cleaved mica (Plano W. Plannet GmbH, Wetzlar, Germany) for 5 minutes, then extensively rinsed with acetate buffer to remove unadsorbed proteins. The mica was then incubated in a glass trough with 10 ml of chitosan solution for 90 minutes. The surface with the adsorbed enzymes was never allowed to dry during this procedure.
2 ml of the solution was taken at the beginning of the incubation time as well as at the end and subsequently diluted with acetate buffer (1:8). A 1.5ml sample of this solution was mixed with 2 ml of Schales’ reagent in test tubes. The tubes were covered with aluminum foil and heated in a boiling water bath for 15 minutes. After cooling, the solution was filtered and the absorbance at 420 nm was measured versus pure water as reference.
Results and Discussion
Criteria to be Able to Measure Height Fluctuations in Proteins
To measure height fluctuations over individual proteins with the AFM it was necessary to adsorb the molecules on a suitable support. To obtain reproducible results the preparation technique had to fulfill several conditions. The enzymes should be evenly spread across the substrate with a molecular density sufficiently sparse in order to measure height fluctuations on the support in between molecules. However, the density has to be large enough to image many similar proteins in one scan area. Furthermore, the enzymes have to be well adhered to the support. Otherwise they are removed from the substrate while scanning.
The density and distribution of the molecules on mica are affected by three factors: the concentration and amount of incubated protein solution, and incubation time. The strength of adhesion between enzyme and substrate is mainly affected by the charge of the enzymes and can be adjusted by changing the pH of the buffer solution. We used an acetate buffer with pH 5.5, which is much less than the isoelectric point of the chitosanase. So, enzyme molecules were highly positively charged in this buffer. As mica carries a negative surface charge in aqueous solution it can bind to the positively charged proteins. The enzymatic activity of the enzyme was checked at the same pH value. So the measured height fluctuations can be directly compared to the activity quoted by the vendor.
Fig. 1 shows typical AFM images of chitosanase adsorbed on mica. The enzymes are well distributed and adhesion of most molecules is strong enough so that they could be imaged for an hour or even longer without visible changes in structure. The height of the adsorbed molecules is uniformly about 3 nm and the distance between molecules allows measuring height fluctuation measurements on single proteins and also on the support between molecules.
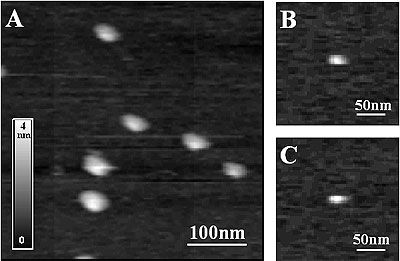
Figure 1. AFM images of chitosanase molecules adsorbed on mica. Images were taken using tapping mode acetate buffer at pH 5.5. The enzyme molecules are well distributed. The molecular density is sufficiently sparse to take height fluctuations data on the support. The height of individual molecules is about 3 nm, as expected.
Enzymatic Activity
The good adhesion of molecules may, however lead to the loss of enzymatic activity. A qualitative activity assay was performed to determine the activity of the adsorbed enzymes. The assay is based on a modification of Schales’ method, a simple color reagent test [23, 24]. To achieve a higher yield, a longer incubation time and a higher protein concentration were chosen as in the sample preparation for AFM imaging. The absorbance at 420 nm will be inversely proportional to the concentration of reducing groups.
The absorbance shows a reduction after 90 minutes incubation time by a factor of 0.37 and 0.29, respectively (data not shown). This corresponds to an increase of reducing groups in the buffer/chitosan solution of 0.16 mM, as can be deduced by comparison with calibration measurements. This result demonstrates that the adsorbed chitosanase is still active. However, it is not possible to determine the value of the enzymatic activity or the turnover number since the number of proteins adsorbed on mica is unknown.
Protein Motion
For observation and measurement of protein motion we applied the protein-tracking technique [17], which overcomes thermal drift by actively keeping the AFM tip over a protein molecule (see Materials and Methods). We typically recorded 50-100 height fluctuation traces of 0.2 seconds duration each on a single molecule. During each data acquisition period the tip stayed at the same place on top of the molecule.
This set of traces recorded on one molecule at a given experimental condition is called a data set. Since lateral thermal drift had a velocity of about 1 nm/second or less and the investigated proteins have dimensions of several nanometers, the tip remained safely on top of the molecule during each data acquisition period of 0.2 s. Fig. 2 shows typical traces of height fluctuation data obtained on mica and on top of a chitosanase molecule. Fig 2A was recorded in pure buffer, whereas Fig. 2B the enzyme’s substrate has been added (1 mM chitosan pentamers).
The fluctuations on mica are unaffected by different buffer conditions, while there are significant differences between the traces on chitosanase. The traces on mica show fast fluctuations of about 0.2 nm in height and less than 3 ms in duration. These fluctuations seem to be randomly distributed and can be attributed to thermal and electronic noise of the instrument.
The traces on inactive enzyme molecules also show the same noise plus slow fluctuations in the range of 0.2 nm in height and 15-50 ms in duration. Since there is no substrate (chitosan) present in the buffer, these fluctuations are not due to enzymatic activity but may reflect thermally excited conformational changes of the molecule itself.
The traces on active chitosanase molecules show in addition spikes with amplitude of typically 0.4 nm, duration of 2-8 ms at a rate of 100-150 s-1. Since these characteristic fluctuations are found neither in the traces taken on mica nor on the inactive or inhibited (see below) enzyme, they are likely to represent catalytic events.
This assumption is supported by the value of the enzymatic activity (208 U/mg), as quoted by the vendor. This activity corresponds to a turnover number of 120 s-1. This is in very good agreement with the rate of spikes in the AFM data and implies that the enzymatic activity is not significantly affected by the adsorption of the molecules to the support.
Figure 2. Height fluctuations traces from inactive (A) and active (B) chitosanase molecules as compared with data recorded on mica. The fluctuations on the support were very reproducible with RMS values of about 0.12 nm independent of the buffer solution. The fluctuations on inactive enzyme molecules were slightly higher (0.13 nm) and increased after addition of the substrate (0.20 nm). The spikes in the traces over active enzymes have a typical height of about 0.4 nm, a rate of 100-150 s-1, and duration of 2-8 ms. These spikes are supposed to represent single catalytic events.
Effect of Bivalent Metal Ions on Chitosanase
Next we tested different bivalent metal ions for their inhibitory properties, in particular how the duration, the rate, and the height of individual catalytic events are affected. Apart from the well-known inhibitor Cu2+, Mn2+ and Zn2+ were also tested. For this purpose we added 5 mM of CuSO4, MnCl2, or ZnCl2 to the buffer solution. Height fluctuations on mica were not affected by the addition of the metal ions and the RMS values were in all cases 0.12 nm (data not shown), exactly as in the pure acetate buffer and the chitosan solution.
Height fluctuations of protein molecules in buffer with Cu2+ ions did not show the characteristic spikes as they were found in the traces taken in chitosan solution (see Fig. 3). There were no significant differences to those taken over inactive enzymes, i.e. in the pure acetate buffer. This shows that Cu2+ is able to inhibit the chitosanase from Streptomyces griseus totally. No more catalytic events are observed after addition of Cu2+. The RMS value of the height fluctuations is 0.13 nm, calculated from the data sets taken over seven individual proteins. This is identical with the value of the inactive enzyme in pure acetate buffer.
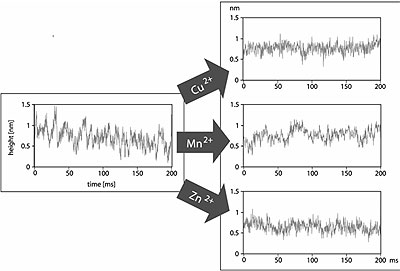
Figure 3. Influence of different bivalent metal ions on the height fluctuations of chitosanase. Cu2+ is able to inhibit the enzyme totally. The spikes, which were seen in the traces on active protein molecules, disappeared and the traces were similar to those taken on inactive protein in pure acetate buffer (see Fig. 2). Traces after addition of Mn2+ show also fluctuations with amplitude of about 0.4 nm, but they last longer (20-50 ms) and appear at a lower rate (20-25 s-1) as the spikes found in the traces of chitosanase with substrate, but without ions. The traces over chitosanase with Zn2+ ions in the buffer solution show also fluctuations with duration of 20-50 ms, but with an amplitude of only ≤0.3 nm. Therefore it is difficult to assess whether these fluctuations are due to an activity of the enzyme.
The height fluctuations after addition of 5 mM Mn2+ show also fluctuations with amplitude of about 0.4 nm (see Fig. 3), but they last longer as those in the traces taken in the pure buffer/substrate solution. These fluctuations have a period of 20-50 ms and a rate of 20-25 s-1. They are not so clearly defined as the spikes, which were seen on the active chitosanase. Assuming that these fluctuations are a sign of remaining enzymatic activity, the duration of the individual catalytic events increases by one order of magnitude while the rate decreases by a factor of 5-6. The RMS of height fluctuations, calculated from six different data sets, has a value of 0.15 nm, which also indicates that Mn2+ inhibits the protein motion of chitosanase from Streptomyces griseus only partially.
Finally the influence of Zn2+ ions on protein motion of chitosanase was tested. The traces show slow fluctuations with a period of 20-50 ms, but with an amplitude of only ≤0.3 nm (see Fig. 3). So they are much lower than the spikes in the traces over the active enzymes, which represent the catalytic events. Furthermore they are not clearly defined and restricted at all. Though these fluctuations have lower amplitude as those observed after addition of Mn2+, the RMS calculated from seven individual data sets is also 0.15 nm. Although Zn2+ ions are not able to inhibit the protein motion completely, standard activity assays would be necessary to judge, whether these fluctuations are related to a (remaining) enzymatic activity or not.
Height Fluctuations and Buffer Solutions
Height fluctuations were recorded over 28 individual inactive and 18 active proteins under different buffer conditions. Each data set comprises 50-100 traces of height fluctuations of 0.2 seconds duration. Furthermore almost the same number of measurements were done on mica as a reference. To quantify differences between the different categories we calculated for each dataset the root mean square of height fluctuations.
We calculated the mean square deviation for each trace, averaging all values within one dataset and finally taking the square root to obtain a RMS (root mean square) value. Figure 4A shows the summarized data from one experimental run with several datasets taking on enzyme molecules in pure buffer in the presence of substrate, and in the presence of substrate and Cu2+ ions. The RMS on the support had a value of 0.12 nm in all cases.
Height fluctuations on inactive enzyme molecules were slightly higher (RMS 0.13 nm). This may be due to the fact that proteins are soft structures in comparison with the rigid support. Therefore it can show thermal fluctuations in height. After addition of the substrate to the buffer solution the RMS of height fluctuations increases to around 0.20 nm. This increase is due to spikes as seen in the individual height fluctuation traces reflecting the activity of the enzyme (see above). Mn2+ and Zn2+ showed only a partial reduction of activity (see Fig 4B and 4C).
Figure 4 .Comparison of the mean rms values for different experimental conditions. Each panel shows values on chitosanase molecules and on the mica support as reference. Each panel compares data for the enzyme molecules in pure buffer (control), in the presence of substrate (standard active conditions) and in the presence of substrate plus different bivalent ions: Cu2+ (fig. 4A), Mn2+ (fig. 4B), and Zn2+ (fig. 4C).
The averaged data from figure 4 are compiled in the following table.
Table 1. Summary of experimental conditions and average of fluctuation values.
|
|
|
Buffer
|
0.12
|
22
|
0.13
|
29
|
|
buffer + substrate
|
0.12
|
18
|
0.20
|
19
|
|
buffer + substrate + Cu2+
|
0.12
|
1
|
0.13
|
7
|
|
buffer + substrate + Mn2+
|
0.12
|
5
|
0.151, 2
|
6
|
|
buffer + substrate + Zn2+
|
0.12
|
8
|
0.151, 2
|
7
|
1 value is significantly different from mica value with a probability between 1-2x10⁻⁵.
2 value is significantly different from substrate value with a probability between 3-4x10⁻⁴.
From the RMS values of the height fluctuations we can conclude:
• In the presence of substrate the protein motion is strongly increased (0.20 nm) in comparison to the inactive enzyme (0.13 nm in pure buffer).
• In both cases the fluctuations are significantly larger than the instrumental noise determined on the mica support (0.12 nm)
• Cu2+ ions, a known inhibitor, reduce protein motion to the level of the inactive enzyme (0.13nm)
• Mn2+ and Zn2+ reduce protein motion not completely (0.15 nm). This may correspond to only partial inhibition of the enzyme’s activity.
Conclusions
Height fluctuations over chitosanase from Streptomyces griseus have been measured by using an AFM operated in fluid tapping mode. Protein molecules were electrostatically adsorbed to mica and adhesion was strong enough to image and investigate them by AFM. The adsorbed proteins still exhibited enzymatic activity, which was verified by a qualitative activity assay. To measure height fluctuations over individual proteins for prolonged times protein-tracking was used, which periodically repositions the AFM tip onto the center of a molecule in order to compensate thermal drift of the microscope.
It was shown that protein-tracking enables direct observation of single catalytic events by monitoring height fluctuations of single molecules. These fluctuations were about 0.4 nm in height, which is on the same order than those from chitosanase from Streptomyces sp. N174, determined by x-ray crystallography. The rate of spikes in height traces over active chitosanase molecules (100-150 per second) matches the enzymatic activity as claimed by the vendor (120 per second). Furthermore, the duration of individual catalytic events can be determined (2-8 ms), which cannot be done by conventional activity assays.
Different bivalent metal ions were tested for their inhibitory effects. After addition of Cu2+ the enzyme looses its enzymatic activity completely. Mn2+ or Zn2+ reduced protein motion only partially, which may correspond to a partial inhibition of the enzyme’s activity.
Acknowledgements
This work was supported by the Deutsche Forschungsgemeinschaft (M. A. and M. F.), the Volkswagen-Stiftung (M. A. and M. R.) and the Gemeinnützige Hertie-Stiftung/Stifterverband für die Deutsche Wissenschaft (T.E.S.).
References
1. Binnig G., Quate C. F., et al., "Atomic force microscope." Phys. Rev. Lett. 56(9) 930-933 (1986).
2. Rugar D. and Hansma P. K., "Atomic force microscopy." Physics Today 43(10) 23-30 (1990).
3. Hansma H. G. and Hoh J. H., "Biomolecular imaging with the atomic force microscope." Annu. Rev. Biophys. Chem. 23 115-139 (1994).
4. Hansma H. G., Browne K. E., et al., "Bending and Straightening of DNA Induced by the Same Ligand: Characterization with the Atomic Force Microscope." Biochemistry 33 8436-8441 (1994)..
5. Florin E.-L., Moy V. T., et al., "Adhesion forces between individual ligand-receptor pairs." Science 264 415-417 (1994).
6. Rief M., Gautel M., et al., "Reversible unfolding of individual titin immunoglobulin domains by AFM." Science 276 1109-1112 (1997).
7. Hoh J. H., Lal R., et al., "AFM and dissection of gap junctions." Science 253 1405-1408 (1991).
8. Müller D. J. and Engel A., "The height of biomolecules measured with the atomic force microscope depends on electrostatic interactions." Biophys. J. 73(9) 1633-1644 (1997).
9. Persike N., Pfeiffer M., et al., "Direct observation of different surface structures on high-resolution images of native halorhodopsin." J. Mol. Biol. 310 773-780 (2001).
10. Yang J., Mou J., et al., "Molecular resolution atomic force microscopy of soluble proteins in solution." Biochim. Biophys. Acta 1199(2) 105-114 (1994).
11. Willemsen O. H., Snel M. M. E., et al., "Biomolecular interactions measured by atomic force microscopy." Biophysical J. 79 3267-3281 (2000).
12. Hansma P. K., Cleveland J. P., et al., "Tapping mode Atomic Force Microscopy in liquids." Appl. Phys. Lett. 64(13) 1738-1740 (1994).
13. Putman C. A. J., van der Werf K. O., et al., "Tapping mode atomic force microscopy in liquid." Appl. Phys. Lett. 64(18): 2454-2456 (1994).
14. Dreier M., Anselmetti D., et al., "Dynamic force microscopy in liquids." J. Appl. Phys. 76 5095-5098 (1994).
15. Fritz M., Radmacher M., et al. "Imaging globular and filamentous proteins in physiological buffer solution in tapping mode atomic force microscopy." Langmuir 11(9) 3529-3535 (1995).
16. Radmacher M., Fritz M., et al., "Direct observation of enzyme activity with the atomic force microscope." Science 265 1577-1579 (1994).
17. Thomson N. H., Fritz M., et al., "Protein tracking and observation of protein motion using atomic force microscopy." Biophys. J. 70(5) 2421-2431 (1996).
18. Roberts G. A. F., Chitin chemistry. Basingstoke, Great Britain, Macmillan Press (1992).
19. Schomburg D. and Stephan. D. Enzyme handbook. Berlin, Germany, Springer (1998).
20. Ohtakara A., "Chitosanase from Streptomyces griseus." Meth. Enzym. 161 505-510 (1998).
21. Osswald W. F., McDonald R. E., et al., "Quantitative fluorometric analysisi of plant and microbial chitosanases." Anal. Biochem. 204 40-46 (1992).
22. Marcotte E. M., Monzingo A. F., et al., "X-ray structure of anti-fungal chitosanse from Streptomyces N147." Nat. Struct. Biol. 3 155-162 (1996).
23. Imoto T., Johnson L. N., et al., Vertebrate Lysozymes. The Enzymes. P. D. Boyer. New York, Academic Press. VII: 665-868 (1972).
24. Uchida Y. and Ohtakara A., "Chitosanase from Bacillus spezies." Meth. Enzym. 161: 501-505 (1998).
Contact Details
Markus Arnoldi
Bayerische Landesbank, München
Germany
Tilman Schäffer
Universität Münster
Germany
Monika Fritz
Universität Bremen
Germany
Manfred Radmacher
Universität Bremen
Institut für Biophysik
Otto Hahn Allee 1
28359 Bremen
Germany
[email protected]