Bruker's AcuityXR optical surface profiling system has been designed in such a way that it can significantly enhance the lateral resolution for a broad class of measurements. AcuityXR works on any smooth surface in which the phase of the light is examined and is used to calculate the surface from the white-light-interferometric signal.
Features of AcuityXR
The key features of the AcuityXR are:
- AcuityXR produces a measurement with twice the number of pixels in the X and Y directions than is possible with a standard interferometric measurement.
- Greater detail is achieved for fine features in the measurement, such as more separated lines and sharper scratches or defects. There may be slight ringing near the edges of the field of view or near areas of missing surface data from the processing needed to improve resolution, but this is a normal consequence of the mathematical algorithms used to enhance the resolution.
The examples below detail several use cases where AcuityXR measurements provide significant benefits in detection capability or in quantification of key surface features.
Case 1: Improved Metrology of Narrow Linewidths
One obvious application of improved lateral resolution is to attain superior measurement of narrow linewidth features. To test this, a sample having two 350nm lines, separated by 350nm were measured on a Bruker ContourGT X8 Optical Profiler System using standard Phase Shifting Interferometry (PSI) and AcuityXR PSI measurement 3 modes. Figure 1 shows one measurement from each technique.
The observations are listed below:
- First, it can be clearly observed that by utilizing the AcuityXR measurement, sufficient resolution is reached to show the full separation between the lines, whereas for the PSI image they are blurred enough such that the surface height between the lines is not the same as the rest of the substrate.
- Additionally, fine details of the linewidth variation along the line are seen in the AcuityXR result and not apparent in the standard PSI result. The average linewidth determined using PSI was just 300 nm. Using AcuityXR mode, the average linewidth was 320 nm. Though the AcuityXR result is still slightly smaller than listed on the standard, it can be adjusted based on exactly where the width is taken vertically along the line.
- In terms of numerical measurement performance, the standard deviation of line width for the PSI measurements was 35.1 nm. For the AcuityXR PSI results, the standard deviation is reduced by nearly a factor of 7, to just 5.2 nm. Similarly, during calculation of the line volume, the standard deviations for PSI and AcuityXR PSI measurements are .005 μm3 and 0.001 μm3 respectively, which is a factor of 5 improvement. Hence, significant gains in metrology capability are possible through the enhanced lateral resolution offered by AcuityXR.
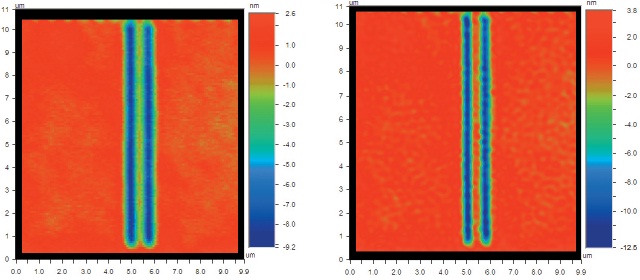
Figure 1. 350nm linewidth measurements taken with Standard PSI (left) with little feature separation and AcuityXR PSI (right), showing high levels of feature differentiation.
Case 2: Feature Separation Capability
In order to actually test the limits of AcuityXR and it’s ability to differentiate fine features, a linewidth standard of successively smaller lines, from 1μm to 100nm, was obtained. Bruker’s exclusive 115X, 0.8NA microscope objective was utilized to offer maximum resolution on the linewidth standard. The lateral resolution of the optical system as obtained using the Sparrow criterion is 314 nm. Features up to 200nm can be easily differentiated both using PSI and AcuityXR PSI modes as shown in Figure 2. However, finer detail and a superior separation are clearly observed using the AcuityXR mode.
At 130nm there was no separation at all visible using normal PSI measurement, while AcuityXR mode was able to show two distinct features. This apparent limit of the lateral resolution capability of AcuityXR enhanced measurements is around 2.5 times smaller than the lateral resolution anticipated from the Sparrow calculation.
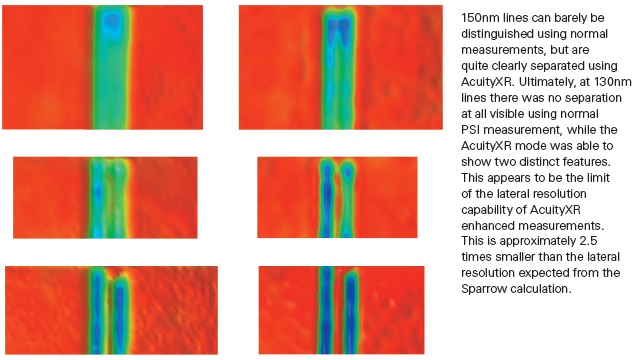
Figure 2. All the images have the same vertical scale of 2nm (red) to -8nm (blue). Standard PSI Measurements (left) and AcuityXR PSI Measurements (right) of 200, 150, and 130nm linewidth features.
Case 3: General Feature Clarity
Normally when examining surfaces, it is essential to identify scratches, defects, or other fine features without necessarily needing to perform gage studies or otherwise quantify each individual feature. For example, this would be a nonsensical laboratory requirement when examining surface finish in orthopedics, medical implants, plastic substrates, or optics. A variety of surfaces were rapidly measured using PSI measurement mode and AcuityXR PSI mode as shown in Figure 3.
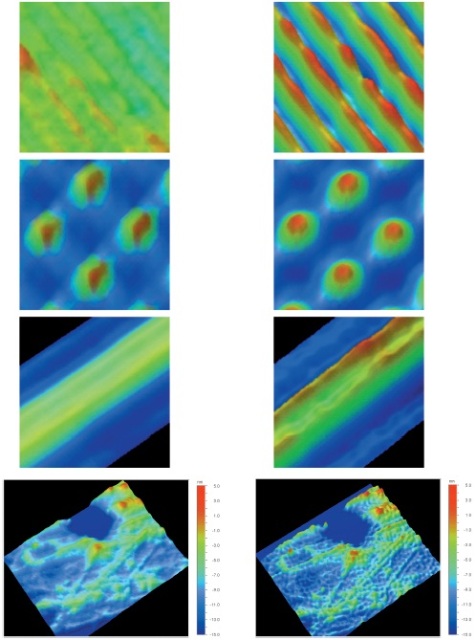
Figure 3. Images taken with Standard PSI (left) and AcuityXR PSI (right) shows vast improvement in AcuityXR PSI in the ability to make images less pixilated while showing the proper structure on the sample.
In each case, the AcuityXR measurement shows sharper features on the gratings and other small defects present in the images. This allows not just superior visual identification, but also a better capability for automatically locating, counting, and quantifying features based on width or height with Bruker’s Vision software.
Limitations of AcuityXR Mode
The limitations of AcuityXR are listed below:
- It is limited to surfaces having local roughness less than approximately 20nm, where PSI or HDVSI measurement modes can conduct measurement of the surface without problems.
- Rough surfaces, such as paper, roughly machined metal, or foams are not appropriate for AcuityXR.
- Also, surfaces having large amounts of missing data may suffer some ringing near the edges of the valid data when using AcuityXR, since the mathematics involved require contiguous surfaces for proper calculation.
Conclusions
AcuityXR is an innovative technology available for most models of Bruker’s optical profilers. It employs system modeling, low-noise measurements, and the integration of multiple surface scans. With this integration, the blur caused by the optical elements can be reduced and lateral resolution considerably enhanced. Greater detail can be seen in many surfaces. For narrow features, AcuityXR also offers significantly enhanced quantification of variations, making process control possible even on small structures. While AcuityXR is not suitable for all surfaces, for smooth, fine features it improves the measurement capability of the optical profiler.
.jpg)
This information has been sourced, reviewed and adapted from materials provided by Bruker Nano Surfaces.
For more information on this source, please visit Bruker Nano Surfaces.