IR spectroscopy is a highly popular analytical measurement method employed for polymeric material characterization. This is largely restricted to macroscopic analysis as Abbe diffraction laws restrict the spatial resolution of conventional bulk IR spectroscopy to between 3 and 10 µm, dependent on the kind of technique used.
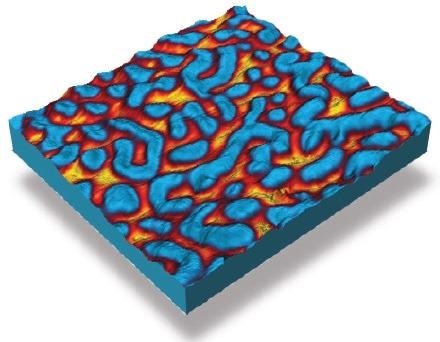
PS/PMMA blend chemical contrast image using Tapping AFM-IR™. Image Credit: Bruker Nano Surfaces
Atomic Force Microscopy (AFM) is an established nanoscale imaging technique, offering a topographic map of a surface sample high spatial resolution. The main drawback, until recently, of using AFM has been the incapacity to chemically characterize the material below the tip. This can be resolved by employing an AFM cantilever as a detection point for incident IR radiation.
The outcome is an AFM-IR method that resolves the diffraction threshold of conventional IR spectroscopy by orders of significance while retaining the high-resolution imaging capacities of AFM.1
In this article, the application of AFM-IR to operate nanoscale chemical characterization on a variety of polymeric samples is considered.
Characterization of Multilayer Films2
Multilayer films are a critical component of multiple products, particularly in packaging materials. Characterization is required after reducing the thickness of multilayer layers improves the number of specific layers.
FT-IR spectroscopy is a broadly employed characterization method for cross sections of multilayer films, delivering data on the chemical nature of the specific polymers layers providing their thickness is at minimum a few micrometers. Previously, it was necessary to delaminate the films for assessment of particular layers that are thinner than the diffraction limit of traditional FT-IR. These limitations can be surmounted by employing AFM-IR, which is able to offer genuine nanoscale chemical characterization.
Microtome is employed to cross section the samples, and the cross-sectioned samples are then put on IR transparent substrate (ZnS) for analysis (Figure 1a) in order to reverse engineer multilayer films. The subsequent AFM-IR spectra are characterized by corresponding colored markers. Here, the film contents were effectively categorized as polyethylene and polyamide (Figure 1b and 1c).
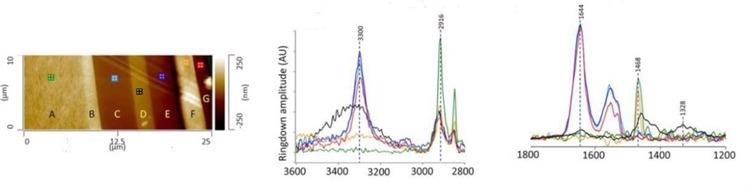
Figure 1. (a). AFM height image showing cross sectioned multilayer film. AFM-IR spectra at 2800-3600 cm-1 (b) and 1200-1800 cm-1 (c); spectra collected from layers C, E, and G are consistent with a polyamide. The IR spectrum recorded from layer D, which can be considered as the barrier layer in the film, is consistent with polyethylene-co-(vinyl alcohol) (EVOH). Image Credit: Bruker Nano Surfaces
Every layer within multilayer films presents a function, like moisture or oxygen barrier layers. “Tie” layers are required to combine these layer materials together throughout film formation because inconsistency is widespread throughout these layer materials. Up to now, characterizing these tie layers employing FT-IR spectroscopy has not been possible because their thickness is lower than 500 nm.
One instance is the association of polyethylene (PE) and polyamide (PA); they need a tie layer to be placed between them because they are not compatible inside films.
An AFM height image and AFM-IR spectra from the boundary area between the PE and PA layer of a cling film cross section are displayed in Figure 2. The nine colored marker locations on the AFM image relate to the AFM-IR spectra of the same color (100 nm spacing).
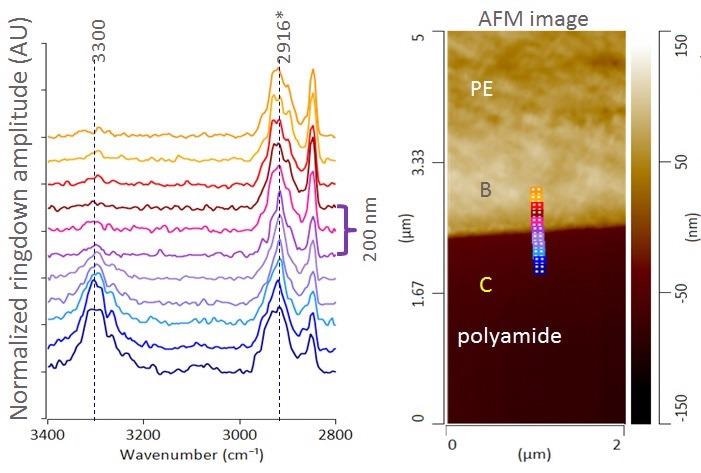
Figure 2. AFM height image and AFM-IR spectra across PE/PA layer interface. Image Credit: Bruker Nano Surfaces
The spectra found inside 200 nm of the boundary comprise considerably sharper CH2-stretching bands than the areas of the PE, which are a greater distance from the boundary. The center-of-mass peak wavenumber of the CH2 antisymmetric stretching band also moves to a smaller wavenumber (2916 cm-1) at the boundary, suggesting there are more ordered hydrocarbon and less branched chains. This results in precise chemical characterization of the tie layers between polymers now being feasible.
Measuring Monolayers3
Self-assembled monolayers (SAMs) of 4-nitrothiophenol (NTP) and a monolayer island sample of poly(ethylene glycol) methyl ether thiol (PEG) were placed on template-stripped gold substrates. Employing AFM topography measurements, the thickness of the NTP monolayer films was proved to be smaller than 1 nm (Figure 3a).
AFM-IR spectra and molecular structures of NTP SAMs on gold (in blue) can be seen in Figure 3. Every AFM-IR spectrum is derived from an estimated sample surface area of 25 nm × 25 nm, restricted merely by the contact zone of the AFM probe with the sample.
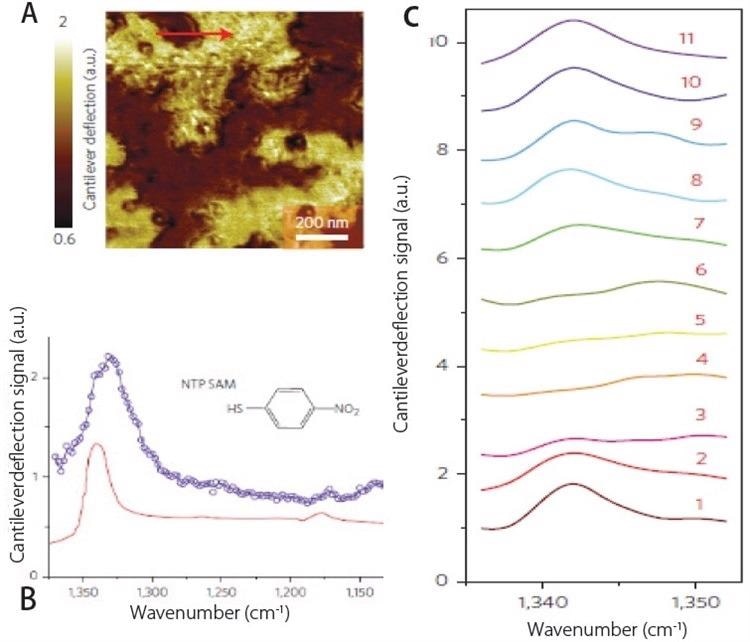
Figure 3. (a) AFM deflection image showing SAM’s of NTP on gold substrate. (b) Comparison of AFM-IR spectrum (blue) and ATR spectrum (red) of NTP SAM’s. (c) Array of AFM-IR spectra collected across red line shown in (a) demonstrating spatial resolutions of ~20 nm. Image Credit: Bruker Nano Surfaces
Figure 3c displays the matching IR reflection absorption spectra developed over a significantly bigger area of NTP SAMs in red.
A powerful NTP absorption peak of about 1339 cm-1 is related to the symmetric NO2 stretching mode, while the weaker absorption band about 1175 cm-1 relates to an aromatic CH-bending mode. Figure 3c displays a variety of AFM-IR spectra logged throughout a gap in the monolayer. The spatial resolution accomplished was ~20 nm for these measurements.
The AFM topography image can be seen in the top left of Figure 4, and an IR absorption image with the IR laser adjusted to the fixed wavenumber of 1340 cm-1 of a monolayer island film of PEG on gold is displayed in the top right of Figure 4.
From the AFM image, the thickness of the PEG islands is discovered to be 4 nm. The IR absorption band at 1340 cm-1 correlates to a CH2-wagging mode, and the position of the PEG island regions is verified by the image. PEG monolayer island regions as minor as 25 nm × 25 nm can be resolved simply in the IR absorption image.
The wide IR band focused at 1102 cm-1 is allocated to the C-O-C antisymmetric stretching mode.
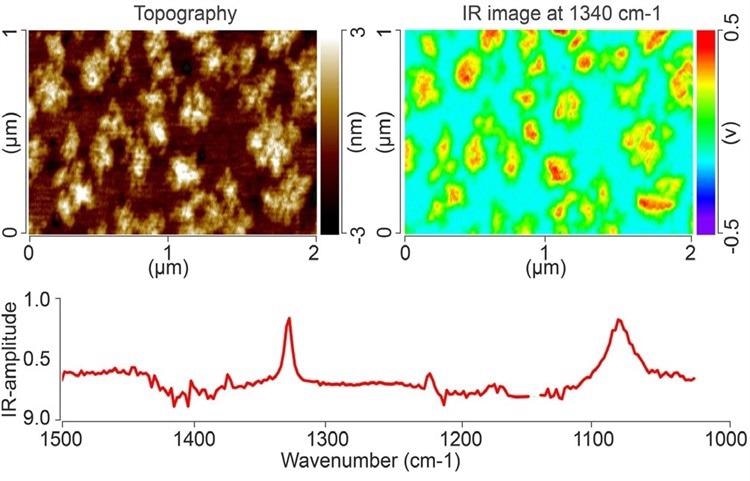
Figure 4. AFM topography image (top left), and IR absorption image at 1340 cm-1 (top right) of a monolayer island film of PEG on gold. An AFM-IR spectrum of one of the PEG islands is shown below. Image Credit: Bruker Nano Surfaces
Quantifying Chemical Content in Nanoscale Polymer Domains4
Attractive attributes like heat resistance, processability and tensile strength mean polypropylene (PP) is a highly valuable and broadly used polymer. Despite this, the poor impact resistance of this polymer, particularly at low temperatures, restricts its widespread implementation.
A new copolymerization technique had been established to tackle this obstacle, enhancing the impact resistance and performance of PP by combining it with other polymers.
Figure 5 illustrates the structure of these high impact polypropylene (HIPP) materials. Three separate regions occur in these materials: the core, intermediate layer, and matrix. The capacity to examine the chemical composition of every region is required to enhance the performance of HIPP.
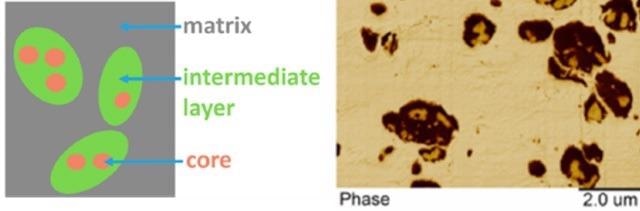
Figure 5. Schematic diagram and AFM phase image showing different regions within high impact polypropylene sample. Image Credit: Bruker Nano Surfaces
IR spectroscopy is typically a powerful method of assessing chemical composition, but domains within HIPP are not big enough to be examined by conventional FTIR. Based on the strong relationship between conventional FTIR and AFM-IR, FTIR was employed to achieve a calibration from standards with established material composition, to facilitate correlation the ethylene content in the copolymers with the peak area ratio of the CH2 and CH3 bending bands at ~ 1456 cm-1 and ~ 1378 cm-1, respectively.
Figure 6 shows a zoomed in AFM image of the nanoscale domains within HIPP, with markers on the image related to the location where AFM-IR spectra were documented from each region within the material, the core (red), intermediate layer (blue) and matrix (black).
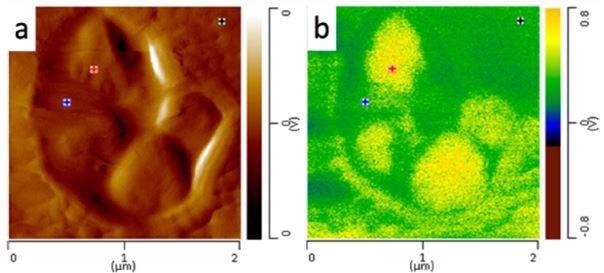
Figure 6. (a) AFM height image of nanoscale core domains and (b) AFM-IR image of domains at 1378 cm-1. Image Credit: Bruker Nano Surfaces
Normalization of the acquired spectra shown in Figure 7 to 1378 cm-1 enabled the comparison of the AFM-IR peak ratio data to the FTIR calibration curve (See Table 1 in the application note).
 Download the Application Note for More Information
The contrast of the peak ratios to the calibration curve produced by FTIR permits determination of the chemical content of every region (See Table 2 in the application note).
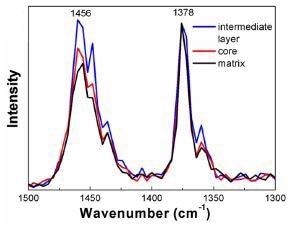
Figure 7. AFM-IR spectra acquired from each region within the HIPP. Data has been normalized to 1378 cm-1. Image Credit: Bruker Nano Surfaces
Conclusions
AFM-IR is a powerful characterization method for a variety of polymer materials.
The mixture of the capacities of AFM and IR spectroscopy allows the nanoIR2-FS system to accumulate topographical images of the sample surface and characterize the chemical composition of these materials with a spatial resolution of <20 nm.
This article has examined the characterization or reverse engineering of polymer multilayer films using the AFM-IR technique. This innovative technique has also enabled the characterization of the tie material between film layers for the first time. Moreover, polymer crystallinity and chemical content have been quantified at a high spatial resolution.
References
- Dazzi, A.; Prazeres, R.; Glotin, F.; Ortega, J.M.; Opt. Lett. 2005, 30, 2388-2390.
- Kelchtermans, M; Lo, M; Dillon, E; Kjoller, K; Marcott, C; Vib. Spec.2016, 82, 10-15.
- Gong, L; Chase, B; Noda, I; Liu, J; Martin, D; Ni, C; Rabolt, J; Marcomolecules. 48, 6197 – 6205.
- Tang, F.; Bao, P.; Su, Z., Analytical Chemistry 2016, 88 (9), 4926-4930.

This information has been sourced, reviewed and adapted from materials provided by Bruker Nano Surfaces.
For more information on this source, please visit Bruker Nano Surfaces.