Thermal techniques like differential scanning calorimetry (DSC) and modulated temperature DSC (MDSC), thermogravimetric analysis (TGA), thermomechanical analysis (TMA) and dynamic mechanical analysis (DMA) are established techniques for characterizing the structure and morphology of polymers.
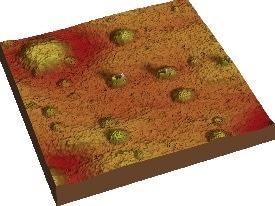
Image Credit: Bruker Nano Surfaces
It is frequently possible to detect and calculate materials by reference to their characteristic transition temperatures and thermal steadiness. However, a significant limitation of traditional thermal techniques is that they provide only a sample-averaged response and cannot offer information on particular elements on or within the sample.
For example, a DSC measurement may suggest that more than one phase is present, but the technique cannot usually offer any information about the size or distribution of phases. This especially impacts scientists in the field of coatings (where flaws such as gel formations can significantly affect performance), polymer blends (where the blend morphologies are crucial to determining their material properties) and composites.
Reading et al. created the Localized Thermal Analysis (LTA) technique [1] to tackle this problem, performing the heating very closely on the sample utilizing a thermal probe to achieve the local thermal response instead of heating the entire sample to develop a sample-averaged reaction.
Until a development in the production of nanoscale thermal probes improved for atomic force microscopy (AFM) by Prof. William King of the University of Illinois at Urbana-Champaign [2], this technique was restricted to micron scale resolution. These probes have enabled local thermal analysis to achieve sub-100 nm resolution along with an AFM and led to the nano-TA method from Anasys Instruments.
Nano-TA is an LTA technique that combines the high spatial resolution imaging capacities of AFM with the capacity to achieve comprehension of the thermal behavior of materials with a spatial resolution of less than 100 nm. A traditional AFM tip is replaced by a special nano-TA probe that has an inbuilt miniature heater and is operated by the specifically designed nano-TA software and hardware in order to achieve this.
The operator is able to select the spatial locations at which to analyze the thermal properties of the surface because the AFM allows a surface to be visualized at nanoscale resolution with its standard imaging modes. The operator then develops this information by applying heat locally via the probe tip and assessing the thermomechanical response. Many instances are present in the literature of the use of sub-100 nm LTA in the area of Polymers and Pharmaceuticals. [3-6].
A recurrent concern for the nano-TA technique is its connection to bulk thermal analysis. One likely concern is the AFM probe size generates a contact pressure of approximately 10 MPa when in nano-TA mode, two orders of magnitude greater than the contact pressure of bulk thermomechanical analysis TMA. Additionally, the bigger contact radius from the probe creates problems associated with the notion of traceability to the bulk measurements.
This does not mean that bulk and local measurements can or should agree because the thermal impacts at the nanoscale could have their own dynamics. Recent work has been carried out to identify the link between bulk methods and the nano-TA measurements, and this article evaluates the outcomes in order to understand these traits.
(This paper was originally published as a featured article in the November 2007 issue of American Laboratory, and this article has been excerpted from that paper with the kind consent of the Publishers.)
Experimental Setup
Experiments were carried out employing a Veeco Multimode AFM equipped with an Anasys Instruments nano-TA module and Anasys nanoscale thermal probes.
The images were recorded using tapping mode AFM. The nano-TA data shown is of the probe cantilever deflection (while in contact with the sample surface) mapped against probe tip temperature. Events like glass transitions or melting that take place throughout the softening of the material below the tip produce a downward deflection of the cantilever. Images are frequently recorded following the temperature ramp performance to validate the tested points of interest.
Results and Discussion
Heating rate-dependent deflection curves for these semicrystalline materials (left) and extra amorphous or thermoset systems (right) are displayed in Figure 1. The curves highlight deflection of the cantilever due to enlargement of the surface below the probe until the material yields from the contact pressure during the transition.
Each plotted curve is an average of 3–5 measurements. Heating rates extend over two orders of magnitude, from 0.1 °C/second (bridging typical TMA and DSC rates) to 10 °C/second. Very high heating levels (of up to 10,000 °C/second) are accessible because of the small thermal volume of the probe.
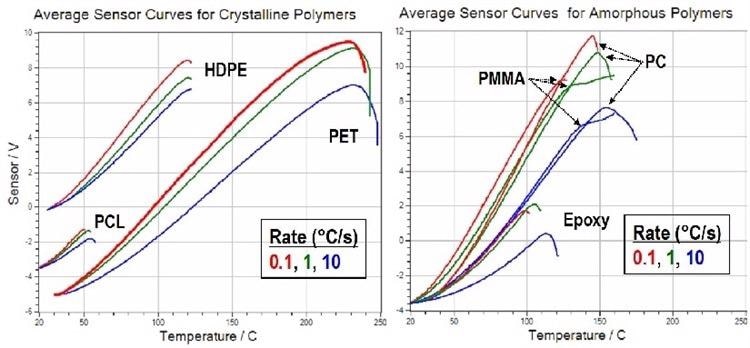
Figure 1. Deflection curves for semi-crystalline materials (left) and amorphous systems (on right). Image Credit: Bruker Nano Surfaces
The crystalline materials have onsets that are relatively invariant to heating rate, overall, whereas the amorphous materials show larger rate dependence as the onsets move to increased temperatures at higher rates. For glass transition or softening of amorphous material, this is as anticipated.
In Figure 2a, the plots provide a least-squares fit of the LTA onset measurements attained at the three heating rates to the DSC onset values attained at 10 °C/minute. Every fit is good, with correlation coefficients larger than 0.99.
The LTA measurements are likely to have positive offsets at all rates contrasted with the DSC onset measurement. Employing a slope and lowest possible offset criteria, the perfect correlation of LTA to DSC is for the onset obtained at the smallest heating rate, 0.1 °C/ second. In a comparable way, in Figure 2b, the LTA results are contrasted with the TMA onset measurements.
This plot provides a least-squares fit of the LTA onset measurements achieved at the three rates to the TMA onset values acquired at 5 °C /minute. The fits are superb, with correlation coefficients exceeding 0.96. The LTA measurements usually have negative offsets at all rates comparative to the TMA onset measurement attained at 5 °C/minute. Employing slope and minimum offset principles, the perfect correlation of LTA to TMA is for the onset achieved at a heating rate of 1 °C/ second. As can be observed from the data, the correlation is good between bulk methods and the LTA method. The offsets of the LTA data contrasted with the bulk techniques suggest that there could be something more subtle about the LTA reaction.
In the case of the DSC, LTA seemingly reacts at a higher temperature than DSC. This could be due to the nature of heat flow in the material as being obtained from the tip versus the ambient. Lower LTA heating rates are obviously closer to the bulk DSC onset temperatures. For TMA, LTA looks to respond at a temperature slightly less than TMA.
This could be sourced in changes in contact pressure and/or enhanced deflection sensitivity. Additional investigation is necessary for both offsets. The absolute values are different but beyond the range of the difference between two standard bulk techniques TMA and DSC.
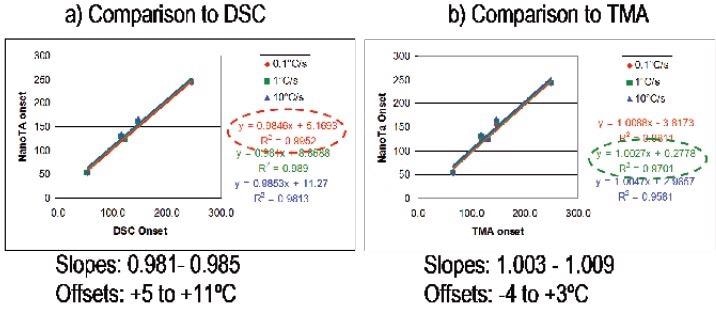
Figure 2. a) Comparison to DSC b) Comparison to TMA. Image Credit: Bruker Nano Surfaces
Conclusions
The researchers contrasted data accumulated on multiple homogenous polymeric samples employing different experimental conditions with both traditional thermal analysis techniques and localized nano thermal analysis. This research has displayed a very high degree of correlation between nanoscale and bulk thermal analysis.
 For a Complete Set of Results Download the Full White Paper
Acknowledgments
The Authors express their gratitude to The Dow Chemical Company and to American Laboratory magazine for permission to excerpt portions of their article published in the Nov 2007 issue.
References
- Hammiche, A.; Reading, M.; Pollock, H.M.; Song, M.; Hourston, D.J. Localised thermal analysis using a miniaturised resistive probe. Rev. Sci. Instr. 1996, 67, 4268–74.
- King, W.P. ; Kenny, T; Goodson, K; Cross, G; Despont, M; Durig, U; Rothuizen, H; Binning, G; Vettiger, P. Atomic force microscope cantilevers for combined thermomechanical data writing and reading. Appl. Phys. Lett. 2001, 78, 1300–2.
- Harding, L.; King, W.P.; Craig, D.Q.M.; Reading. M. Nanoscale imaging of partially amorphous materials using local thermomechanical analysis and heated tip pulsed force mode AFM. Pharm. Res. (in press), 2007.
- Nelson, B.A.; King, W.P. Thermal analysis with nanoscale spatial resolution using heated probe tips. Review of Scientific Instruments (republished on-line in Virtual Journal of Nanoscience & Nanotechnology 15, 2007), 78, 23,702.
- Nelson, B.A.; King, W.P. Temperature calibration of heated silicon atomic force microscope cantilevers. Sensors and Actuators A, 140, 51-59, 2007.
- Germinario, L. Nano thermal analysis of polymers, thin films and coatings. Invited paper, presented at Microscopy and Microanalysis conference, Fort Lauderdale, FL, Aug 5, 2007.

This information has been sourced, reviewed and adapted from materials provided by Bruker Nano Surfaces.
For more information on this source, please visit Bruker Nano Surfaces.